
New dashboard implemented in CMS UI 12.18.0
As part of the CMS UI 12.18.0 release, a new dashboard has been added as a ‘one stop shop’ to enable editors to access all of their content items, thus allowing them to create, edit and review content and have a more holistic view of content and where it sits in the workflow.
The dashboard aims to overcome tedious day to day issues editors faced when searching for specific content. Editors would have to scroll through potentially very complex content trees to find what they are looking for, which in itself could cause some performance issues, and the dashboard fixes this by listing out all of the content items they have been working on in an ordered manner. A concept of the dashboard was first demoed during Opticon 2022, and it generated some really great feedback.
The dashboard will be the first port of call once logged in if the user has access to the CMS Edit UI.
First Release
The first release of the pre-configured dashboard includes two main features (Workflow statuses & Broken Links).
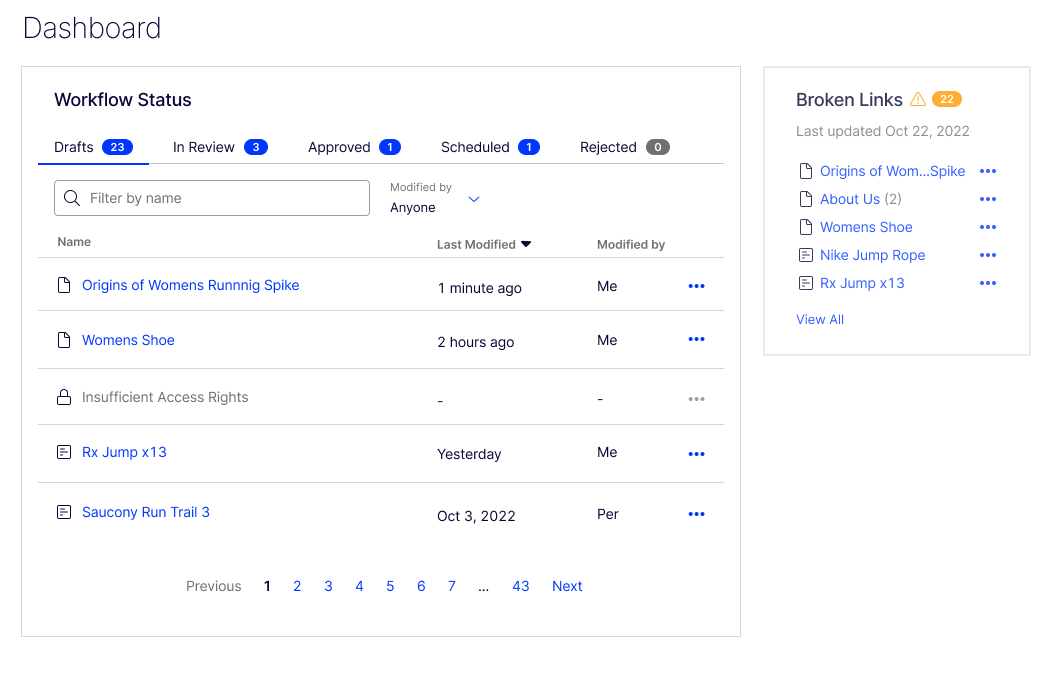
Workflow statuses:
The workflow statuses gadget allows the editors to locate all of their previous work, from all parts of the workflow. The default statuses are as follows:
- CheckedOut (Drafts)
- AwaitingApproval (In Review)
- CheckedIn (Approved)
- DeplayedPublish (Scheduled)
- Rejected (Rejected).
Please note you can add your own status settings if you prefer to.
When you go onto the Dashboard, a total count for each workflow status will be presented, and if there are more than 5 pieces of content within one particular status, then pagination will be implemented allowing editors to access all of their content as they please.
Editors will be able to filter the content shown by either content name, or by changing the ‘Modified By’ tab to either ‘Anyone’ or ‘Me’.
Sorting via all 3 columns is available (Name, Last modified, Modified by), where the default setting is sorting by Name ascending, and the last modified date is displayed in the local time zone.
Broken Links:
The broken links gadget allows the editor to see what broken links exist at the time the Link Validation scheduled job was ran. A ‘Last Updated Date’ is displayed alongside this in the local time zone (using ICurrentCultureAccessor.CurrentCulture).
The editor is then able to click on the link which will direct them to the content where that broken link exists. The broken links gadget will only show content that the current user has the permissions to edit, and will only be updated when the dashboard has been refreshed.
The total count of broken links is generated from the number of broken links that exist in the database.
The broken links gadget will show up to 5 items on the dashboard, and the view full report link is available will which navigate the user to the link status report page – providing more detail around each individual broken link.
If content contains 2 or more broken links, this will be represented within the broken links gadget to avoid duplicated items to provide even more appropriate information for the editor.
Future iterations?
As this is only the first release, we do plan on continuously improving the dashboard and implementing new features to improve the overall usage & experience of this new feature!
How do you build your own widget?
Hey Luc, this isn't something you can do as of yet, it is something that we would be open to the idea of if the want is there.
We want to make sure that the dashboard has a good enough default view before we venture into customisability.
Appreciate I'm a bit late to this party, but hope you can help?
The previous dashboard was its' own ecosystem - we had gadgets (for visitor group statistics, analytics, etc). Our customers have customized their dashboards to suit their particular needs, and we even rely on third parties to build gadgets/widgets to enhance the capabilties.
I don't see much in the release notes for future versions / updates for this dashboard, we are a few versions behind but we still see the "hardcoded" dashboard as above...
Any new releases coming soon/out recently? Where do we see VG/Audience statistics? What about previous gadgets that our customers are used to, but aren't supported on this "new" version (that is objectively more limited across the board?)
re: "good enought default view" - can I ask is there a place to leave feedback? How are you measuring "good enough"?
Thanks!