search
AI OnAI Off
Hi Deepa,
Are you using any third-party image optimization/cropping module? If yes then maybe that module is taking the time.
If you can reproduce locally, you can (and should) use a more powerful profiler, such as dotTrace, to look into details. I think the slowness might come from Find requests (uncached/multiple requests etc.), but that is yet to be seen.
That is strange. Using dotTrace usually gives me the most comprehensive information. Application Insights profiler is good too, but it needs more experience to understand (basically an ETL so it contains a lot of information that can be overwhelming at first)
This is one of the sample for same page from dotTrace and as per your comments may be I am not able to make out of it and it shows more time for Native codes.
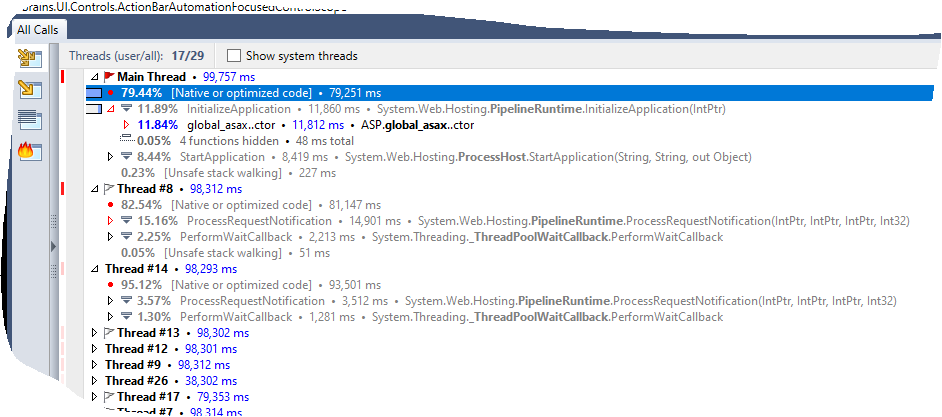
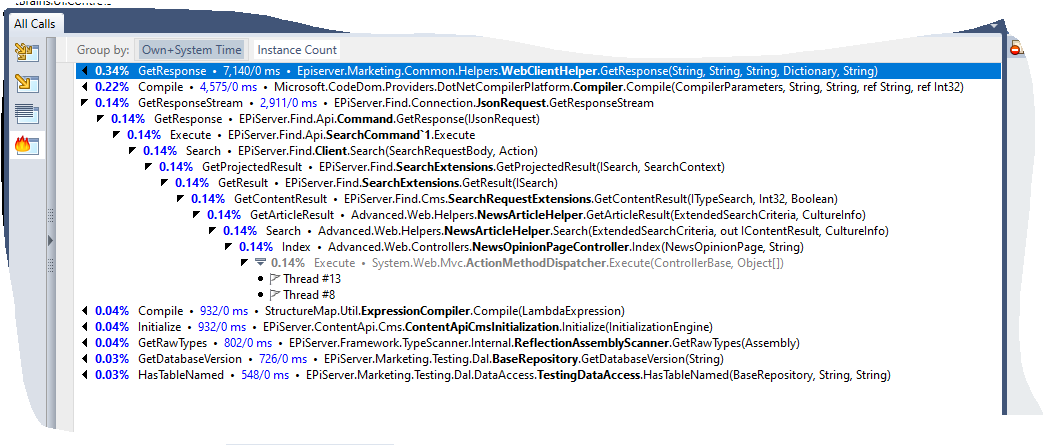
This is one of the sample for same page from dotTrace and as per your comments may be I am not able to make out of it and it shows more time for Native codes.
Try to expand thread #8 -ProcessRequestNotification.
Note that you can always reach out to developer support service for assistance


Hello,
We are using MiniProfiler for one of the slow running page in our website which uses EPiServer Find service to get result to display on page and here is profiling detail in local environment.
What does it mean if it takes more time for URL, is it some EPiServer modules that are taking more time to process?
Thanks,
Deepa