Don't miss out Virtual Happy Hour today (April 26).
Speeding up FindCommerceInitializationModule
If you can use some profilers like dotTrace to profile what actually happens in there, we can look into the result
It sounds to me like it was connection to Find was slow - at start up FindCommerce needs to apply conventions for catalog content types, which is basically sending a request to find service. if the network or the find server is slow - then. The 30 seconds you see might actually when the connection times out.
Thanks,
I ran a dotPeek startup profiler (sampling) and got the following "Hot spots":
Can't really make sense of the percentages, but maybe I'm just reading it wrong.
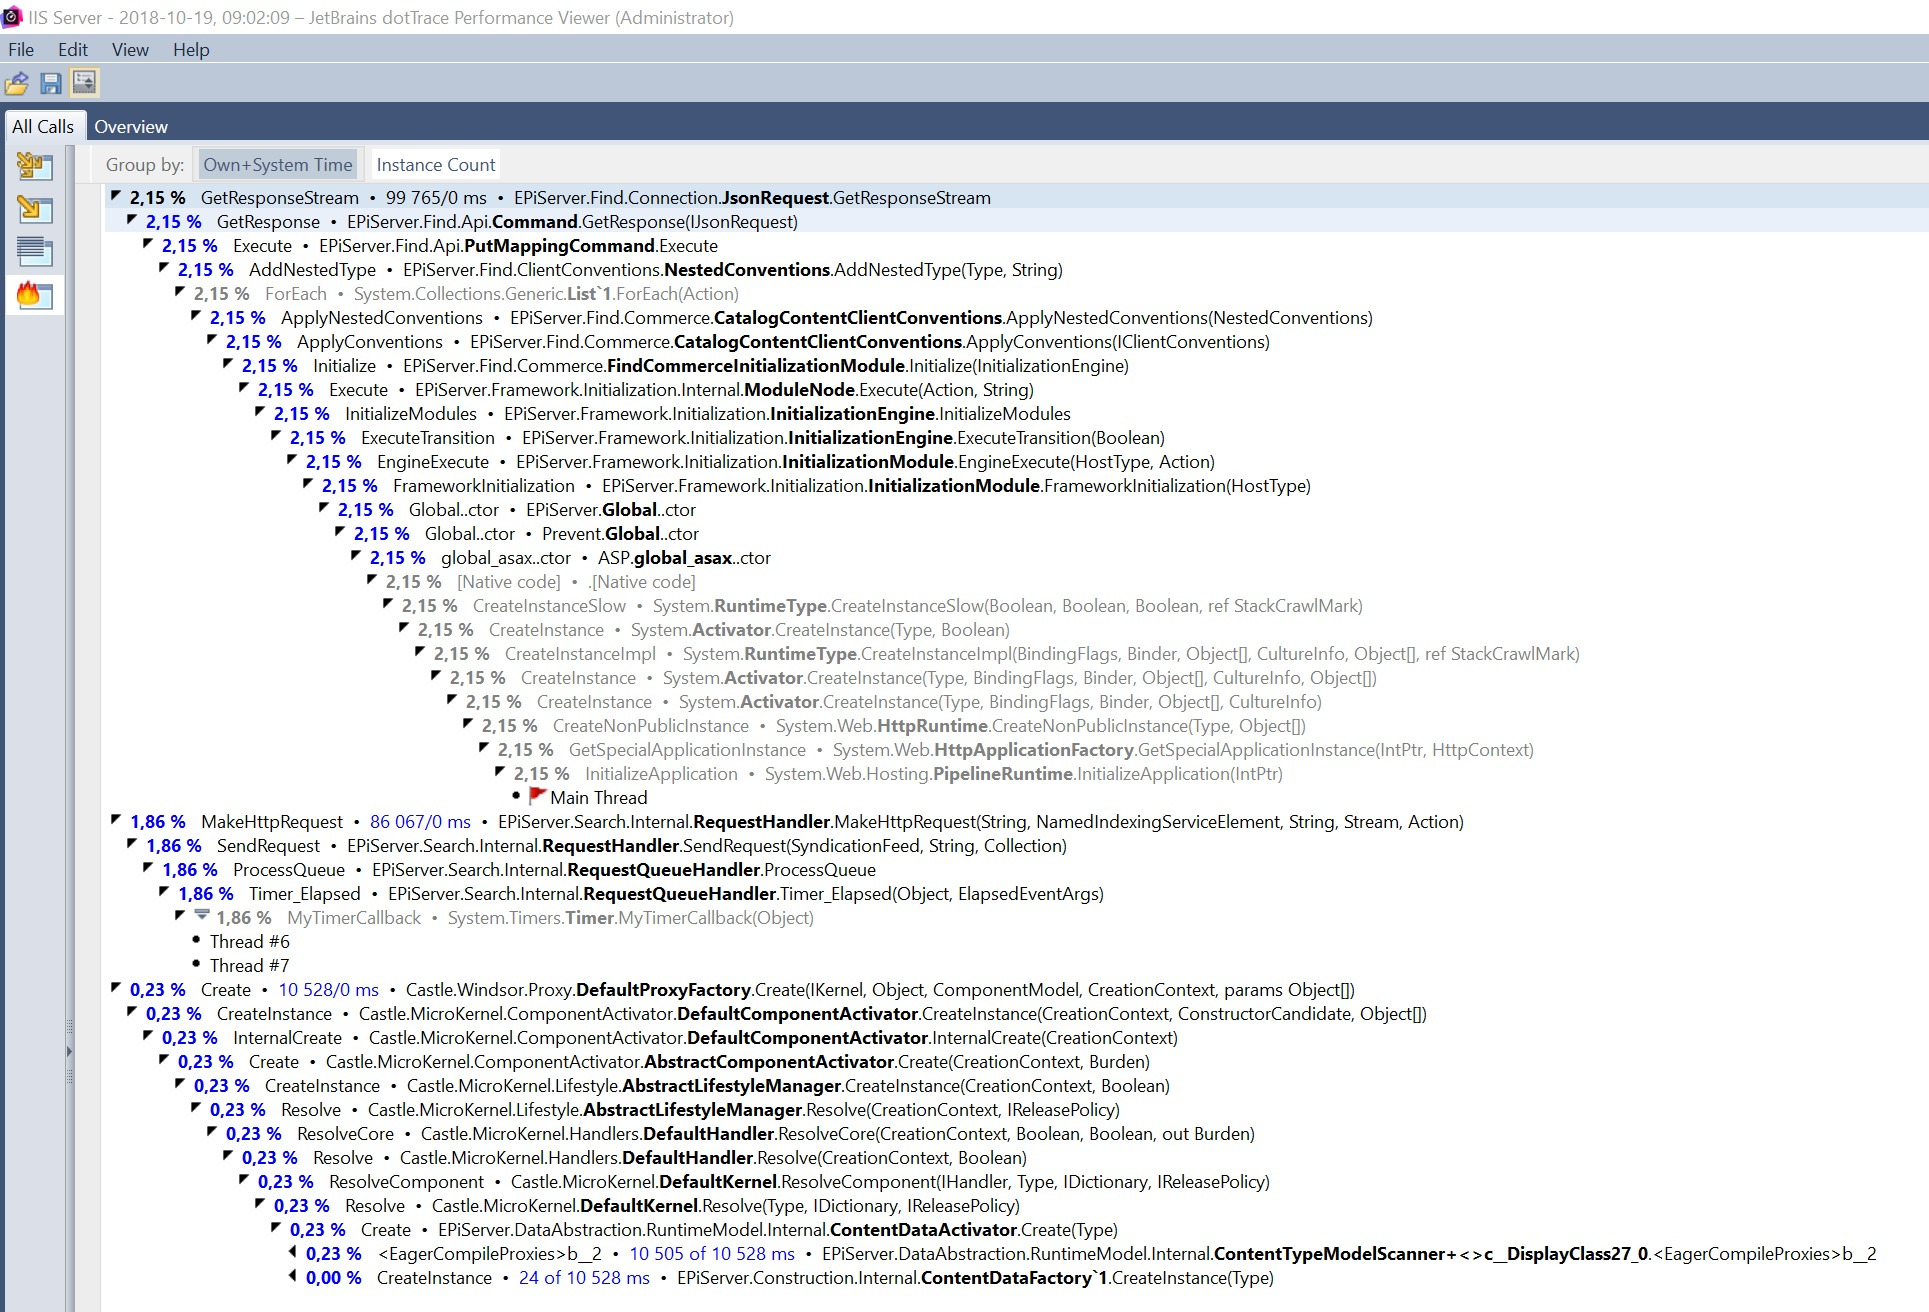
Thanks. I ran a dotTrace startup profiling and got the following Hot Spots. Can't really make sense of the percentages, but maybe I'm reading it in the wrong way. Does it make any sense? Seems like Find-related stuff shows up at least.
If I undestand your photo correctly (it's in a format that I am not very familiar with), it takes about 99s to get response from Find. So the connection is indeed the problem there.
Hi
I have the same issue. Both when running locally and when running from an azure web app.

We have no issues uploading tons of documents to Find so I don't think the connection is an issue for us.
Can you run some profiling like Victor did? I'm pretty sure that if anything is slow then it's most likely the connection to Find to apply the conventions (not sure why), but let's make sure by the profiling results
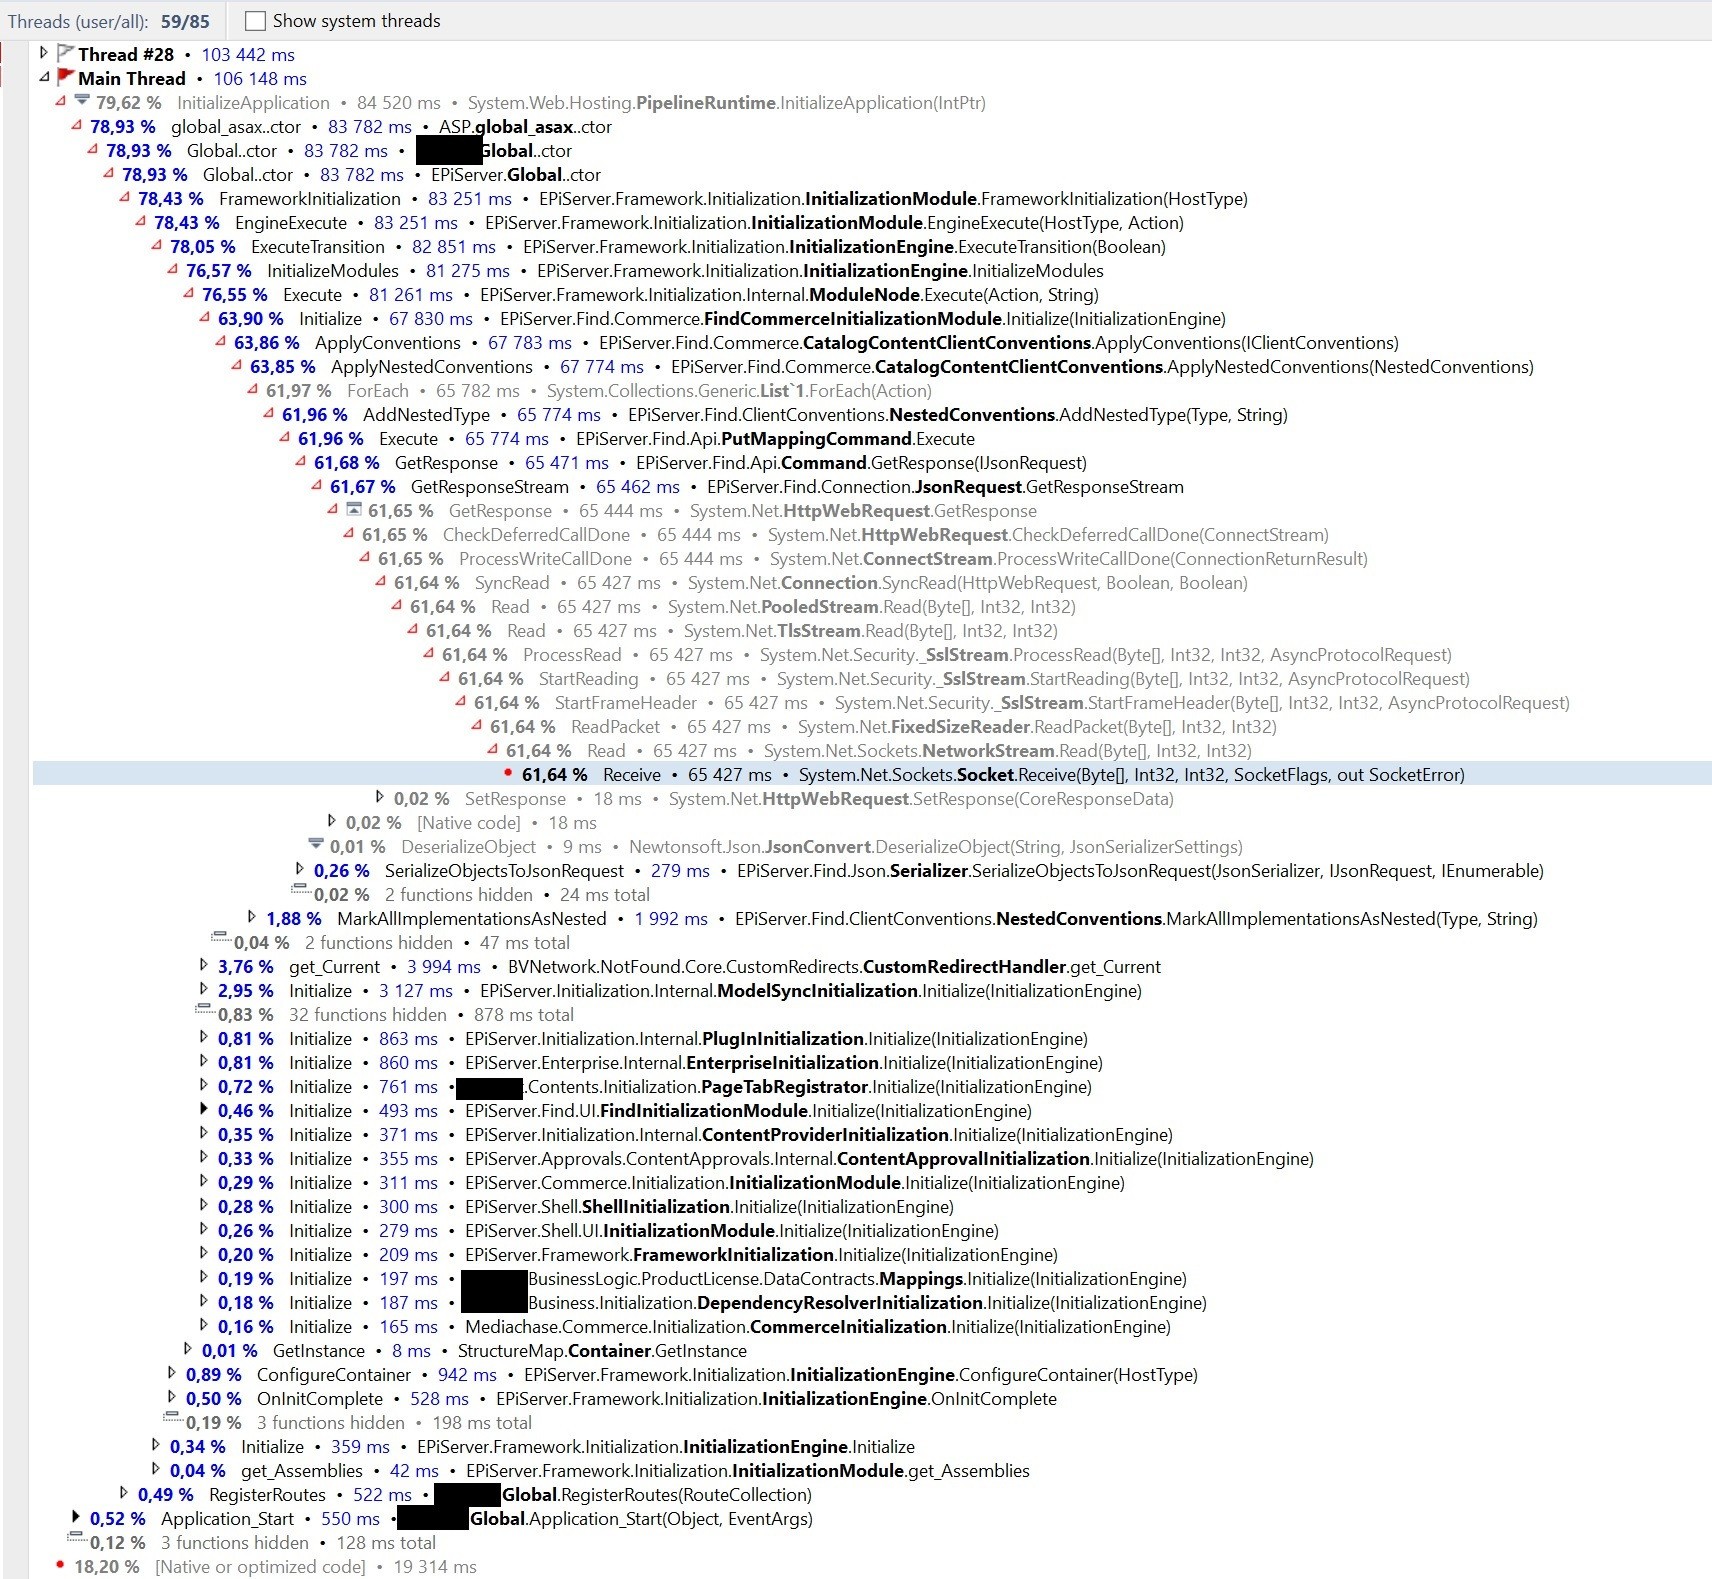
Victor, the result might be easier to read if you look at the Main thread from the All Calls tab. You're looking at hotspots, which is a good way to start, but it provides more details the other way around (especially when you've found the thread to concentrate on).
It is applying nested conventions in a loop, and the 99 sec. sum is probably the combined time it is waiting for the response from Find.
As Quan says, it might be the connection, but it could also be a huge number of nested conventions that needs to be sent sequentially. The wait time shows up as the hot spot.
Another way to see if this is indeed a problem is to attach Fiddler to your local IIS or IIS Express (acting as a system proxy set up in web.config). It would show each round trip to Find, what is sent, and how long it takes. A large number of requests will indicate if something is wrong.
Hey Steve, thanks for the hints. Here's another run as per your suggestions.

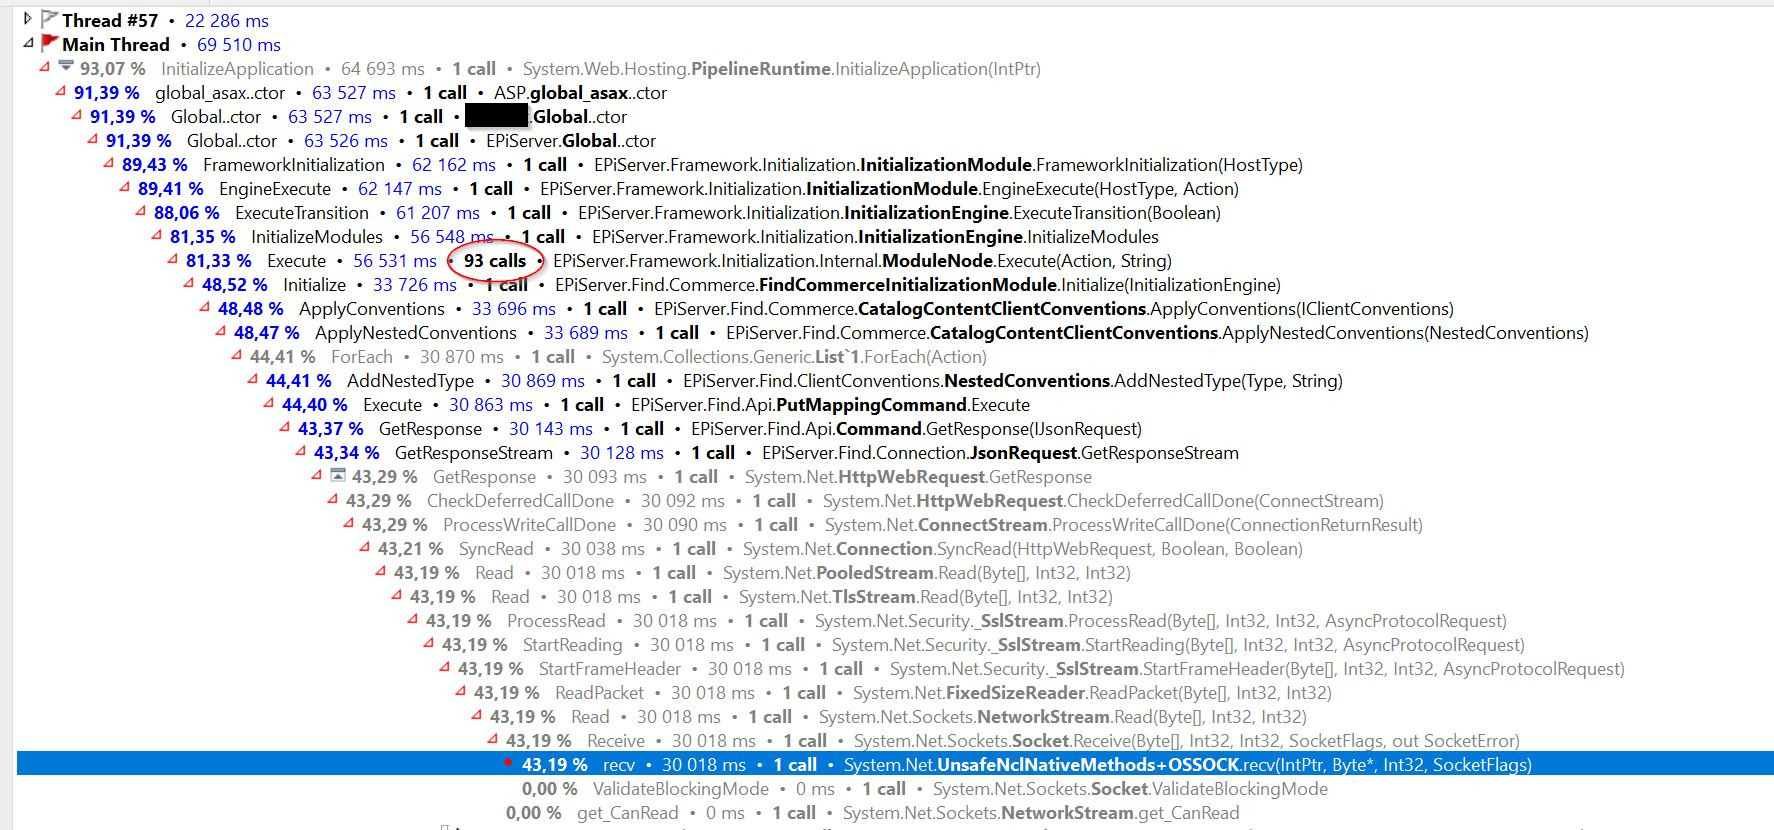
It is also a good idea to run with the call count mode (algorithm or something) - so we know that each call is slow, not that high number of calls that caused the slowness
93 is the total calls for initialization modules so that looks reasonable. So it is indeed the slow call to Find. Looks like 30s is the timeout limit.
Did you check firewall or network setting?
I agree with Quan, this is one long call. Does the rest of the Find functionality seem to work ok?
Can you attach Fiddler and see what it sends? It could be that it actually takes a long time to process on the Find side. If you trace it with Fiddler, you can re-run the query and see if it succeeds when there is no timeout.
If there is a timeout, it doesn't neccessarily mean the call didn't succeed, but if it fails and we can't see it anywhere or do anything about it, why not just sent i async anyway and not have a 30 sec. delay during startup.
Seems like something our support should look at, but it would be nice to see how this behaves in Fiddler.
/Steve


Hello,
After some issues with very slow startups of a site after building our solution locally, I had a look at the Startup Performance View and learned that the assembly EPiServer.Find.Commerce and type FindCommerceInitializationModule takes over 30 seconds to run, making up a majority of the total startup time of 45 seconds or so. Are there any general things we can do or investigate in order to save time here? The next entry on the list completes in under 4 seconds, so the module really stands out.
We are currently running
EPiServer.Find version 12.3.3,
EPiServer.Find.Commerce version 9.7.2
EPiServer.CMS version 10.3.1
Any hints appreciated. Thanks!