
Nested queries in Episerver Find
VIP-Players-Union
So you finally got the promotion you were hoping for and now you the man in charge!
As your first decision you obviously purchase a Episerver CMS and Episerver Find license. Everybody in the company applauds your decision and all are excited about the future possibilities with regards to Episerver Find.
Your first task is to learn about the players that are part of your union. You crack open Visual studio and take a look at the current data model:
public class Team

{

 public Team(string name)

 {

  TeamName = name;

  Players = new List<Player>();

 }

 public string TeamName { get; set; }

 public List<Player> Players { get; set; }

}


public class Player

{

  public string FirstName { get; set; }

  public string LastName { get; set; }

  public int Salary { get; set; }

}
Note: One of the lesser known features in Episerver Find is the support for nested queries. Its a very useful feature when you domain model allows for querying on a complex object structure.
Indexing
You know from your previous experience that data needs to be indexed correctly so that the queries can do their magic.
Something like this will suffice:
            client.Index(new Team("Real Madrid") {Players = new List<Player>()
{ new Player() { FirstName = "Cristiano", LastName = "Ronaldo", Salary = 1000 }}});
            client.Index(new Team("Barcelona"){Players = new List<Player>()
{ new Player() { FirstName = "Lionel", LastName = "Messi", Salary = 999 }}});
            client.Index(new Team("Geriatrics"){Players = new List<Player>()
{ new Player() { FirstName = "Judd", LastName = "Lazarow", Salary = 99 }}});
            client.Index(new Team("Geriatrics"){Players = new List<Player>()
{ new Player() { FirstName = "Lior", LastName = "Lanzer", Salary = 99 }}});
Searching
Note:With Nested queries you will be able to sort, filter and build facets on nested properties. You can read more about it here
In order to present the data in a logical format we make use of the histogram facet functionality which allows us to group the data together in intervals.
No presentation can be complete without an impressive chart and the board of directors was very pleased with the the abilities of their new CEO.
result = client.Search<Team>().HistogramFacetFor(x => x.Players, x => x.Salary, 10).GetResult();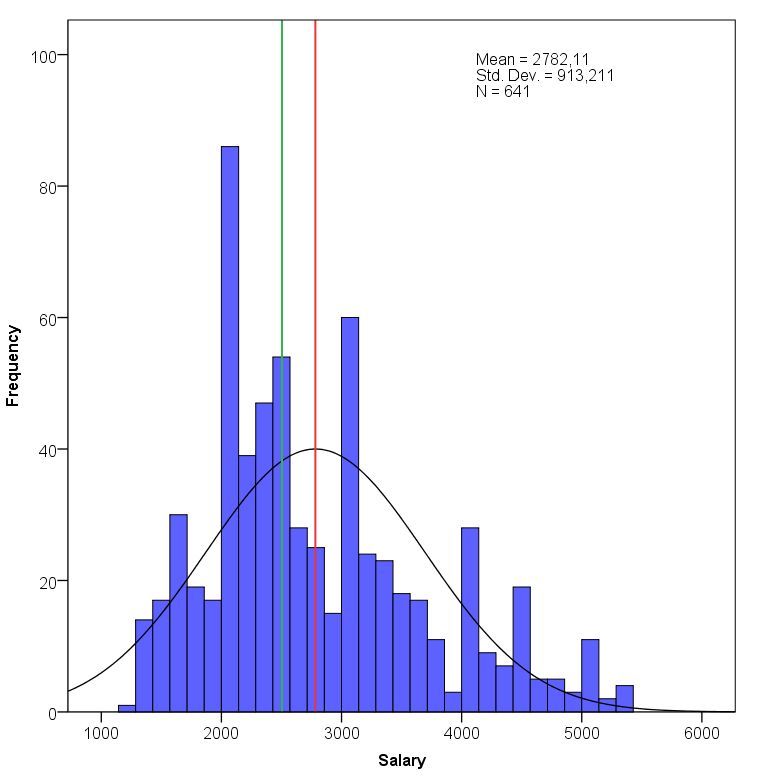
Comments