Per Nergård (MVP)
Jan 28, 2025
  1044
(0 votes)

Content statistics Blazor component

Another week and another MudBlazor component to explore. I wanted to test the charts components so I created a small Blazor component that displays som charts based on information we can get from the pages of a site.

  • How many pages are created / updated on a monthly basis
  • Whats the most used content type
  • When are pages created during the day
  • When are pages being updated during the day
  • Who is the most productive content creator

Not life changing stuff but could be a bit fun to get an overview. Code over at my Gist.

Looks like this in a Alloy solution:
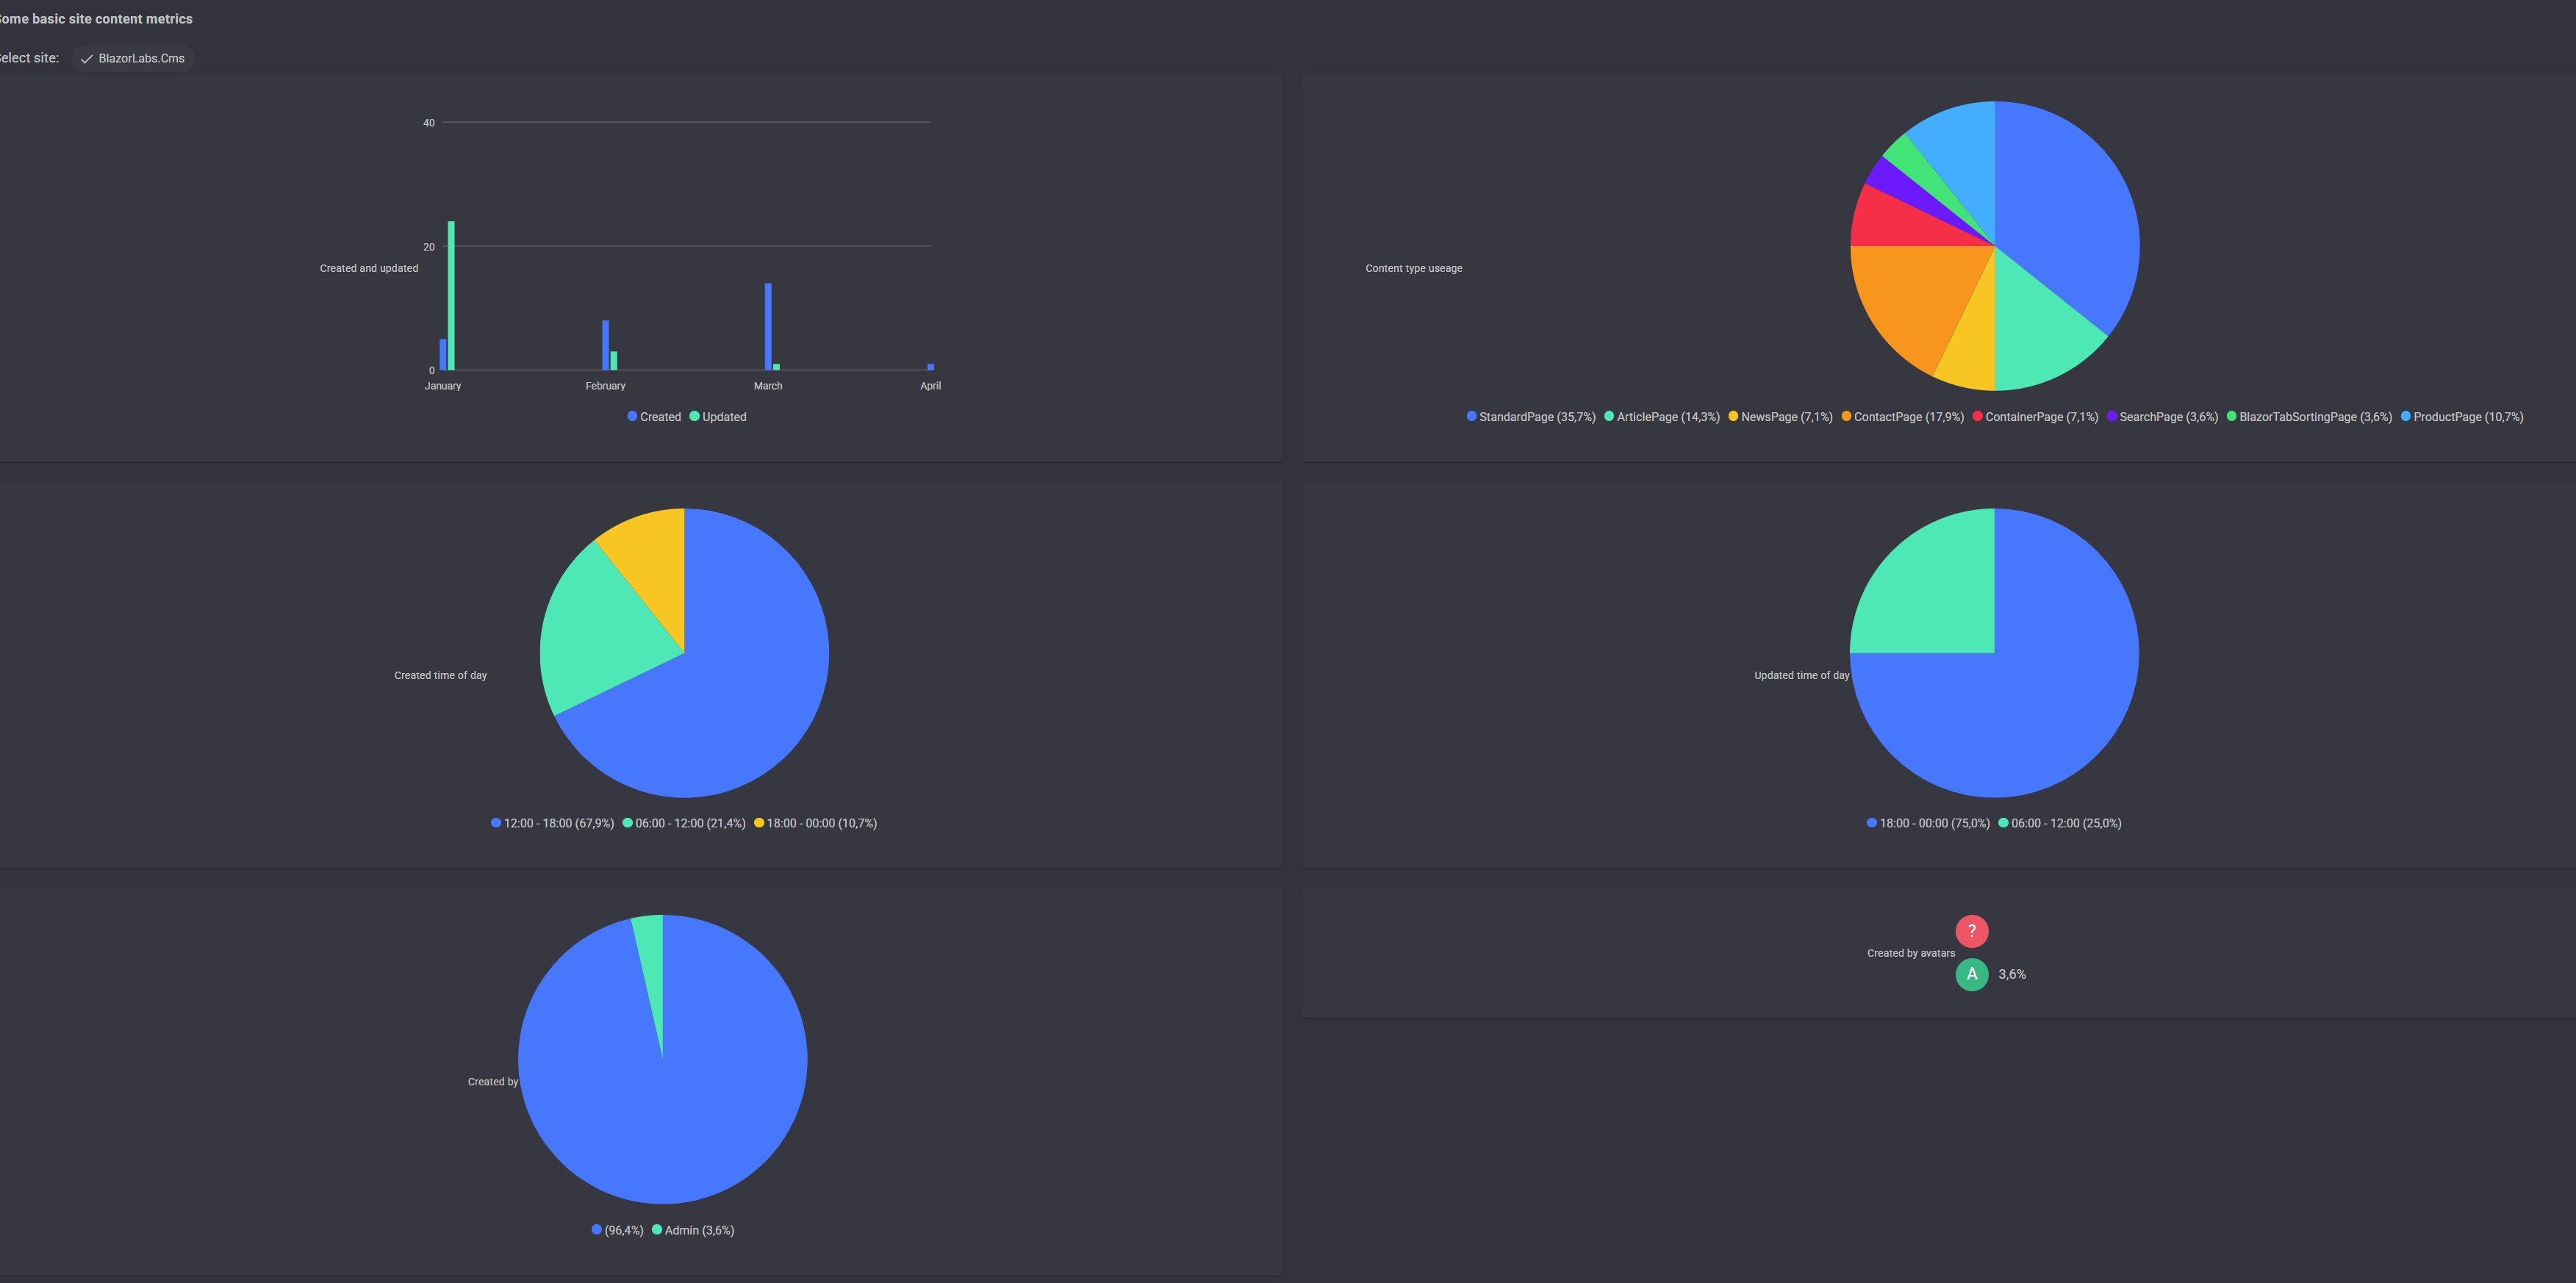
 

Jan 28, 2025

Comments

Please login to comment.
Latest blogs
AEO/GEO: A practical guide

Search changed. People ask AI tools. AI answers. Your content must be understandable, citable, and accessible to both humans and machines. That’s...

Naveed Ul-Haq | Feb 17, 2026 |

We Cloned Our Best Analyst with AI: How Our Opal Hackathon Grand Prize Winner is Changing Experimentation

Every experimentation team knows the feeling. You have a backlog of experiment ideas, but progress is bottlenecked by one critical team member, the...

Polly Walton | Feb 16, 2026

Architecting AI in Optimizely CMS: When to Use Opal vs Custom Integration

AI is rapidly becoming a core capability in modern digital experience platforms. As developers working with Optimizely CMS 12 (.NET Core), the real...

Keshav Dave | Feb 15, 2026

Reducing Web Experimentation MAU Using the REST API

Overview Optimizely Web Experimentation counts an MAU based upon the script snippet rendering for evauluation of web experiement. Therefore when yo...

Scott Reed | Feb 13, 2026