From the Trenches: Slow MainBody Property
Symptoms
On a recent support case I was involved in, a customer had several sites (6) running on a 32 bit Windows Server 2008 in an enterprise setup.
Many of the sites, but not all, was slow at times, and had high cpu utilization.
All the sites had recently been migrated from EPiServer CMS 4, and only been live for approx a week.
Diagnostics
This is a typical indication of one or more slow templates, with non-optimized code of some sort. However, one or two slow templates typically would not slow the whole server down, so some sort of trigger is needed.
A quick way of finding slow running templates is to have a look a the current requests on the sites. IIS 7 will happily show what is going on at any given moment, and can quickly show what requests take the most time.
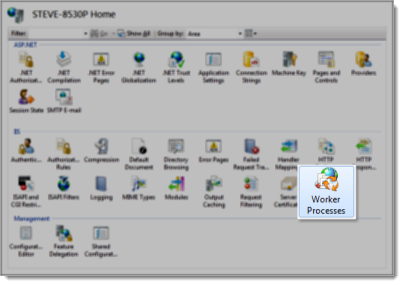
Open IIS, make sure the server is selected:
Click “Worker Process” and you’re presented with a list of all the running sites (or the worker process associated to it to be specific).
As you can see, IIS will show the CPU of the processes and the memory usage. Hit F5 to refresh the list to see which sites maintain a high cpu usage.
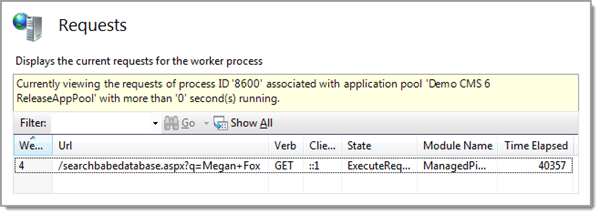
Double click one of the sites, and it will show the current requests:
(click image for full size)
You can see all urls and more importantly, how long they have been running. In the example above, we can see that the request has been running for more than 40 seconds.
Not good. At all.
One such template will not break your site, unless it is hit often. If the request is waiting for a database search, you can have quite many of these before you’ll see any problems, like filling the request queue.
In our case, we could see several requests taking a long time, and most of them used the same template. We had a suspect.
It turned out, there were lots of pages using the same template, and many of them performed quite bad, also in test and development environments. You know you’re almost home when you can reproduce the problem in your development environment.
After some analysis, we found out that the template was showing pages with rather large amounts of content, up to 700KB of content actually. Problem was, the template was really simple, and had no problems in EPiServer CMS 4, so something has changed.
The content was mostly bad html copied from Microsoft Word, with a large markup to text ratio. My first impulse was that all the markup was choking the Friendly Url Rewriter filter handler which parses and looks for urls in the rendered html. Turning it off (by selecting the Null Url Rewrite Provider in episerver.config) did not help though, so it had to be something else.
Next up is to reduce the logic gradually until you’ve got the least amount of logic that still reproduce the problem. In our case, we ended up with an aspx (a template) that only rendered the MainBody property using the EPiServer Property control. The page took 30 seconds to render when the cache was cleared, but the second request only took milliseconds.
Almost there, it had to be something EPiServer CMS 6 do when we ask for the property. Skipping the Property control (using CurrentPage[“MainBody”]) had no effect, so it is inside the EPiServer property data or in the data layer fetching the content.
Good performance on the second request would indicate the data layer was at fault, and the real problem was hid by caching. But no.
I added logging in the different stages of the page life cycle, using System.Diagnostics.Debug.WriteLine in init, load, prerender, render and unload. DebugView (dbgview.exe on http://live.sysinternals.com/) from System Internals shows the logging (just remember to start it as an Administrator). The timing showed that the problem was actually when I read the MainBody from the PropertyDataCollection on CurrentPage.
The property was of type XHtmlLongString, and contained lots and lots of markup. Have you spotted the problem yet?
Dynamic Content.
The first time the MainBody is served (not read from the database), it is parsed to check for Dynamic Content, and this took a long time for these pages because of the large amount of markup that needed parsing (and it was bad markup too.)
The Cure
Changing from XHtmlLongString to just ordinary LongString property on the page type helped a lot. These pages did not have Dynamic Content, and never will, so it is an acceptable compromise.
I mentioned the need for a trigger in the beginning of this article, which some of you might already have figured out. The sites had just recently been migrated from CMS 4, so all urls are new, and the search engines had just discovered this, indexing lots of pages with lots of data. The XHtmlLongString property uses lots of cpu during parsing, so that is the cause of the high cpu utilization.
Additionally, these huge pages uses lots of memory when cached, so the cache was trimmed quite often – adding insult to injury. This is a 32 bit server, with 6 sites on it and only 4GB of memory, which in this particular case should be enough, but won’t over-perform under stress.
The patient is now doing fine.


Did you try to just deselect dynamic content from the options of that Xhtml property? I don't suppose it would help (I mean, it SHOULD render existing dynamic content even if the current setup does not allow more dynamic content to be added), just curious.
Steve: If you have the posibility. Try comparing loading the data on a CMS 6 and a CMS 6 R2 site and compare the differences. The string parser has been replaced in CMS 6 R2 and most of the test cases we have runt show improved performance but it would be nice to compare this case.
We managed to reproduce this issue on a standard Alloy site, and Epi has confirmed a problem with the html / text parser using my sample data. Initial testing indicates that R2 works.
Eheem - Steve, what kind of site was this (ref your search word)? ;-)
@Magnus: We did not test that, but looking at the code in Reflector indicate that it will have no effect.
@Linus: There is a small difference between R1 and R2 Beta :-)
Content: 750K of html in MainBody
Cache is cleared
Time to load:
R1: 140765ms
R2: 113ms
Good work guys and girls!
A small clarification for you working with CMS6, the truth is normally not that bad as Steves figures tell.
The parser used in PropertyXhtmlString in CMS6R2 is faster than the one used in CMS6 but the difference is normally not that big as Steves figures show.
The reason for Steves large figures for the CMS6 parser is because the parser in CMS6 uses a DTD during parsing. This DTD is loaded on the first parsing request (and then cached) meaning the first request for the parser pays a high price (which explains the figure).
Interesting point Johan. Is the DTD loaded and cached for the entire site? Or is it per page data in the cache?
I'm getting mixed results in my tests. If I load the start page first, should that load the DTD too? Also for that slow page?
The DTD is not threadsafe so we actually cache it on a per thread basis (it is marked with ThreadStatic attribute). So to get an accurate test the same thread that you measure time on should have accessed the DTD before the time is measured.
You can ensure the DTD is parsed/loaded by explicitly create an instance of EPiServer.Web.HtmlRewritePipe (the dtd is parsed in the constructor) before the test.