
Identifying Spike Requests and Issues in Application Insights
Sometimes within the DXP we see specific Azure App Instances having request spikes causing performance degredation and we need to investigate. I find the performance tab often lacking to narrow down to the specifics of what I want to look at, so this helps me get to the bottom of things easily
Here's some of my easy steps to figure these out
Step 1: Identify Instance
Open Application Insights and navigate to the Monitoring -> Metrics area and set the following filters
Metric: Log-based metrics, Server response time, Avg aggregation
Split by: Cloud role instance
Set the time range (IN UTC) to when the issue occured and keep narrowing it in until you have a 30 minute or so window
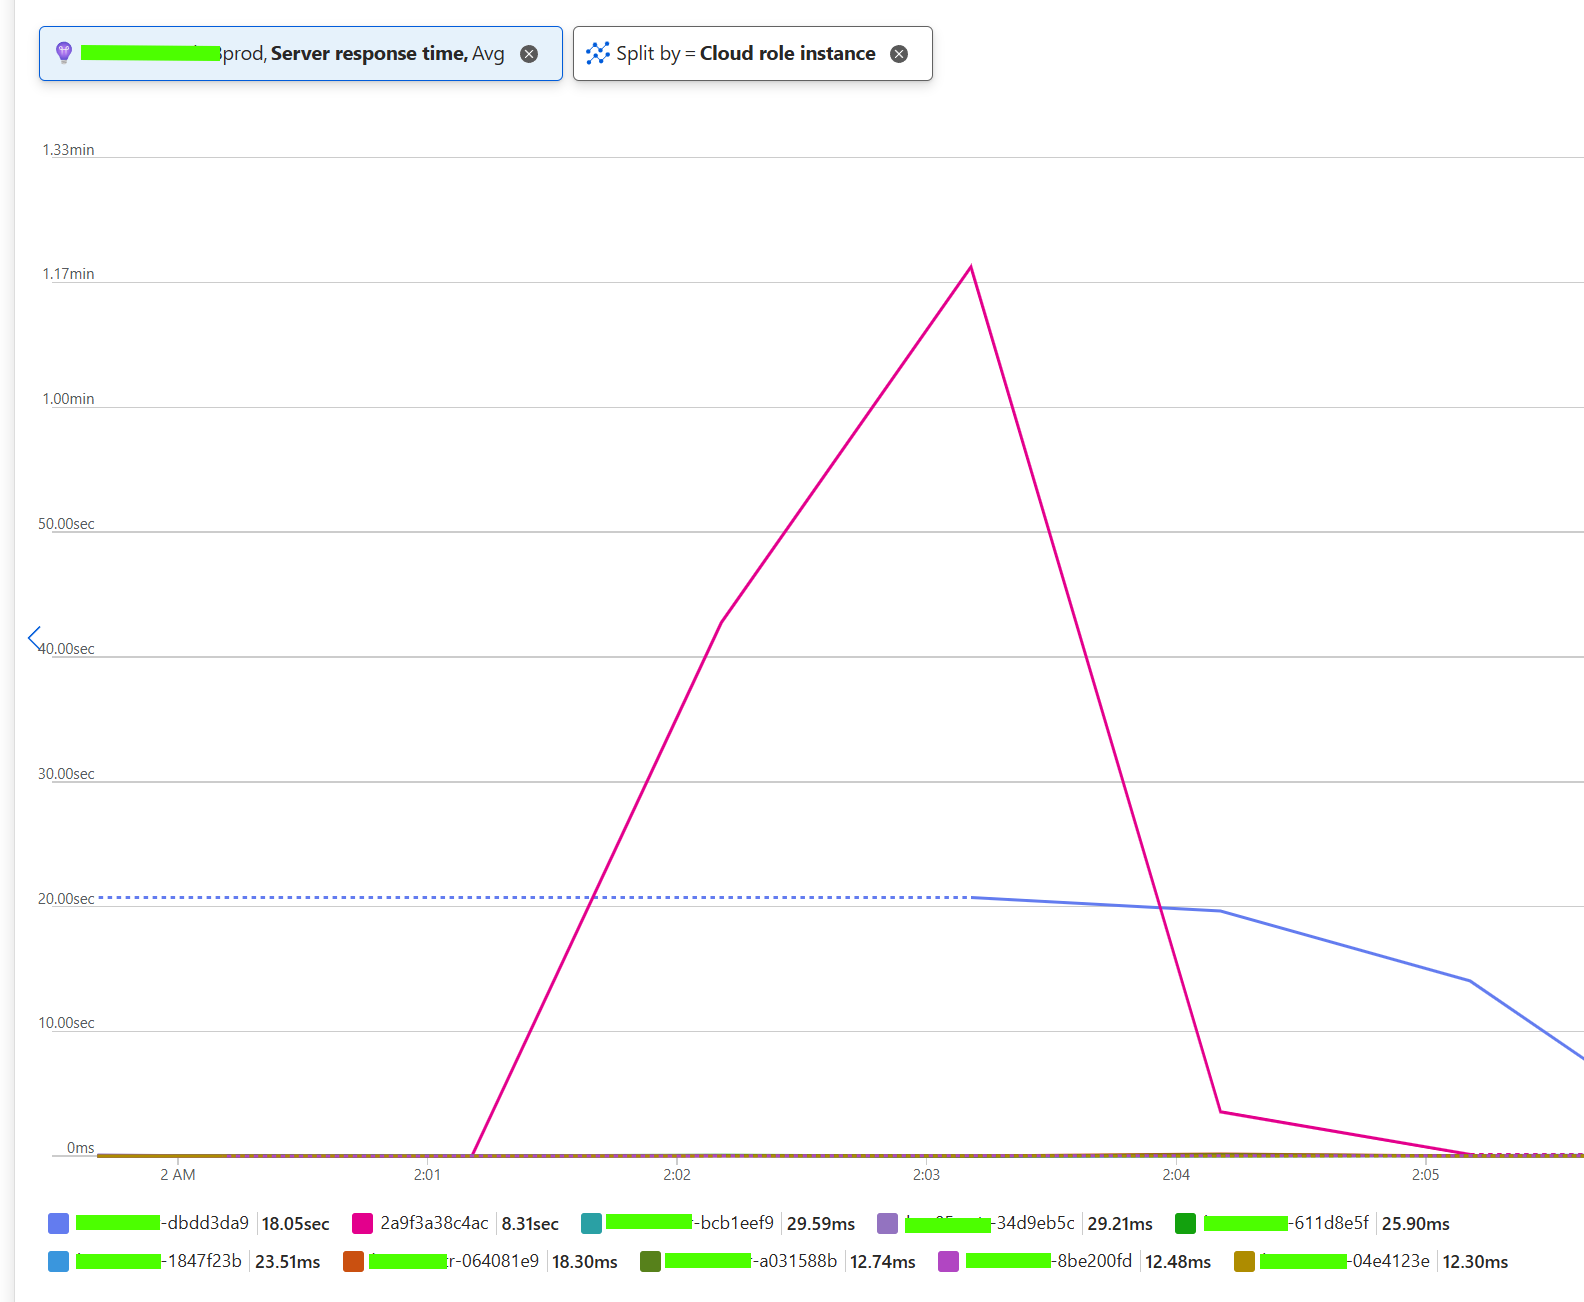
Make a note of the affending instance that's causing the issue, in our case 2a9f3a38c4ac and the 10 minute time range (IN UTC) when the issue occured
Step 2: Extract High Performance Bucket Requests
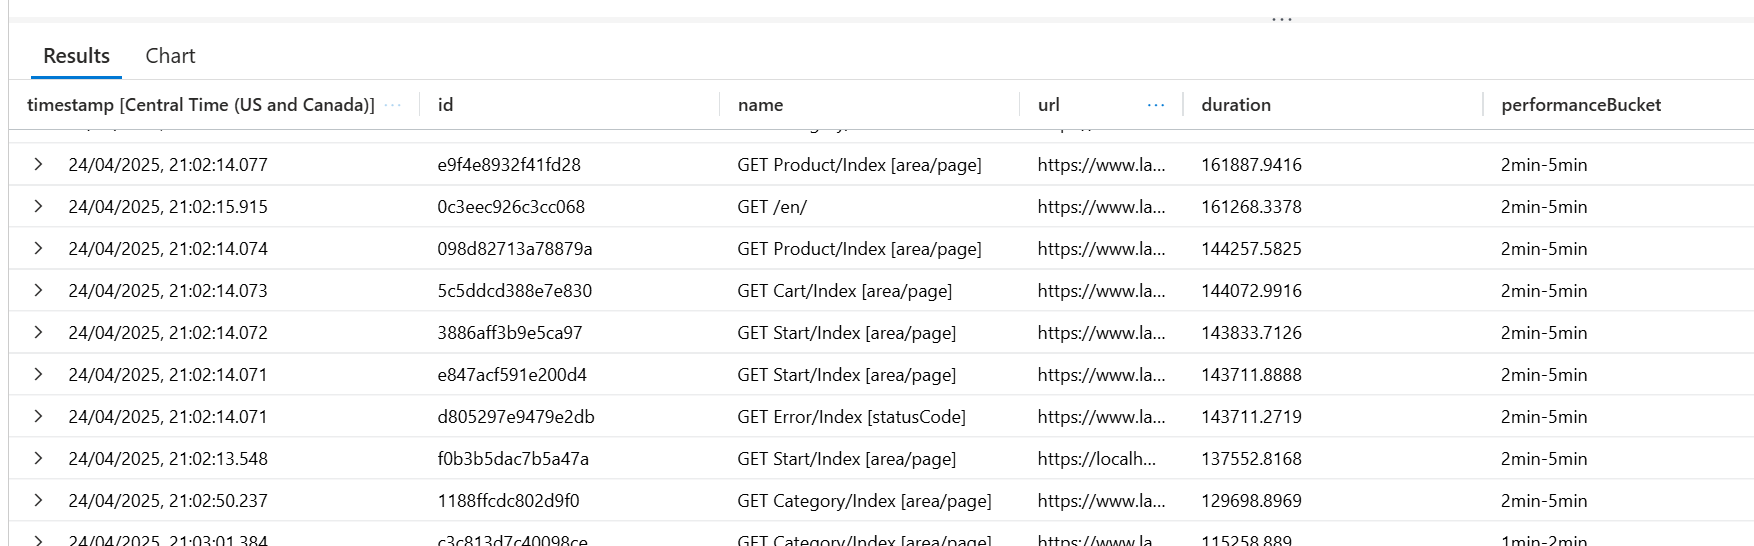
Navigate to the Monitoring -> Logs area and set the following KQL, replacing the INSTANCE with your noted instance. Also in the run area set the time frame in UTC to the 10 minute range noted above
union isfuzzy=true requests
| where cloud_RoleInstance in ("INSTANCE")
| order by duration desc
| take 100
| project timestamp, id, name, url, duration, performanceBucket
This will give you a list you can export to CSV of high requests
Step 3: Viewing Request Details
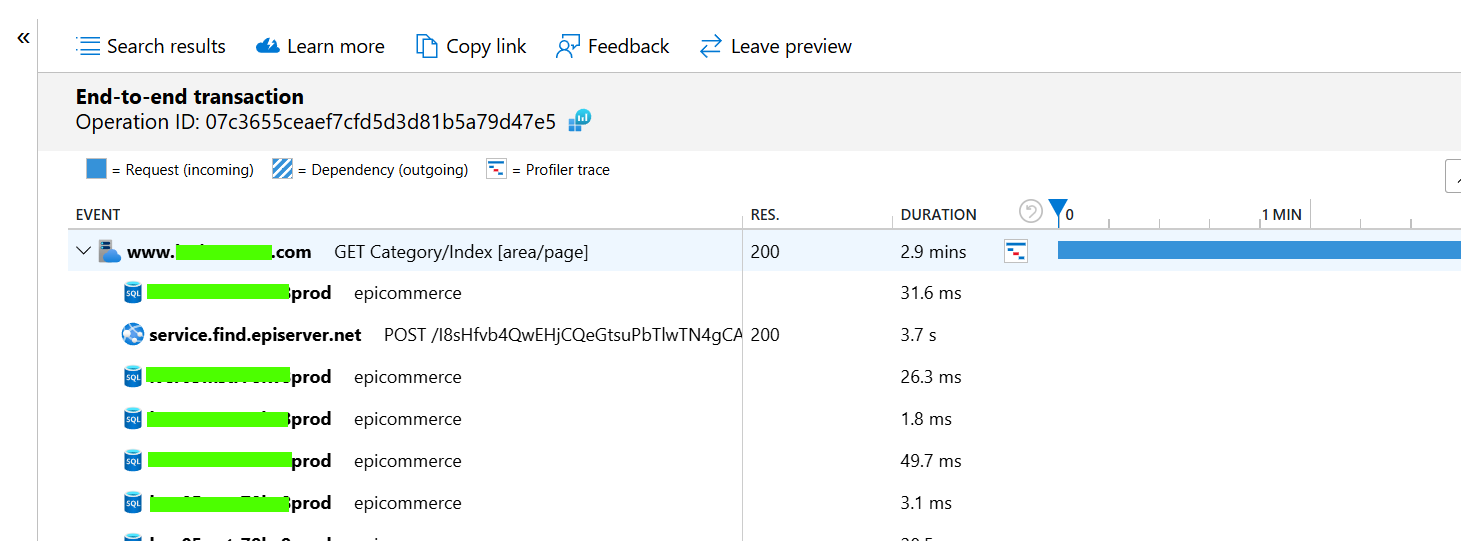
Now navigate to Investigate -> Transaction Search
Set the filter Event Types = Request and in the search copy and of the id values from our list and search. You can then open the request and drill in to dependency issues or profiler traces, in our case to see a slow Find query
Let me know if you have other easier or fun ways to drill in to these types of issues.
Comments