search
AI OnAI Off

What version are you running? Latest CMS 11 update?
I remember a bug related to performance on content items with XhtmlString properties, but that is fixed now...
Thanks for input Tomas, I got this number; 11.20.7.0
Have to research further to see if this number tells me if we are running the latest CMS 11 update :-)
The latest update of CMS 11 is 11.20.10.0 - so you are not. I'm still not able to locate the bug that was fixed, but upgrading to 11.20.10.0 shouldn't be a big deal.
I would run SQL Profiler with duration tracing to see more details from the db and also the actual parameter values.
Get a developer to set up the site with a production db backup if hard to accomplish in Azure.
Combine that investigation with running for example dotTrace and see what is revealed there.
Other things to try could be temporarily disabling event based Find indexing and see if Edit Mode works better then, check if the Queue table for indexing has a massive amount of rows, remove the suspicious blocks and add new "replacement" blocks from scratch or clear ContentArea fields in blocks or pages that seem to be involved.
You could also look around for reporting code that analyzes content for suspicous content area data and other broken references - things that can escape caching and cause db roundtrips every request.
Hi Marcus,
Please reach out to developer support service. this type of issue is best to investigate if we can take a closer look at your databases.
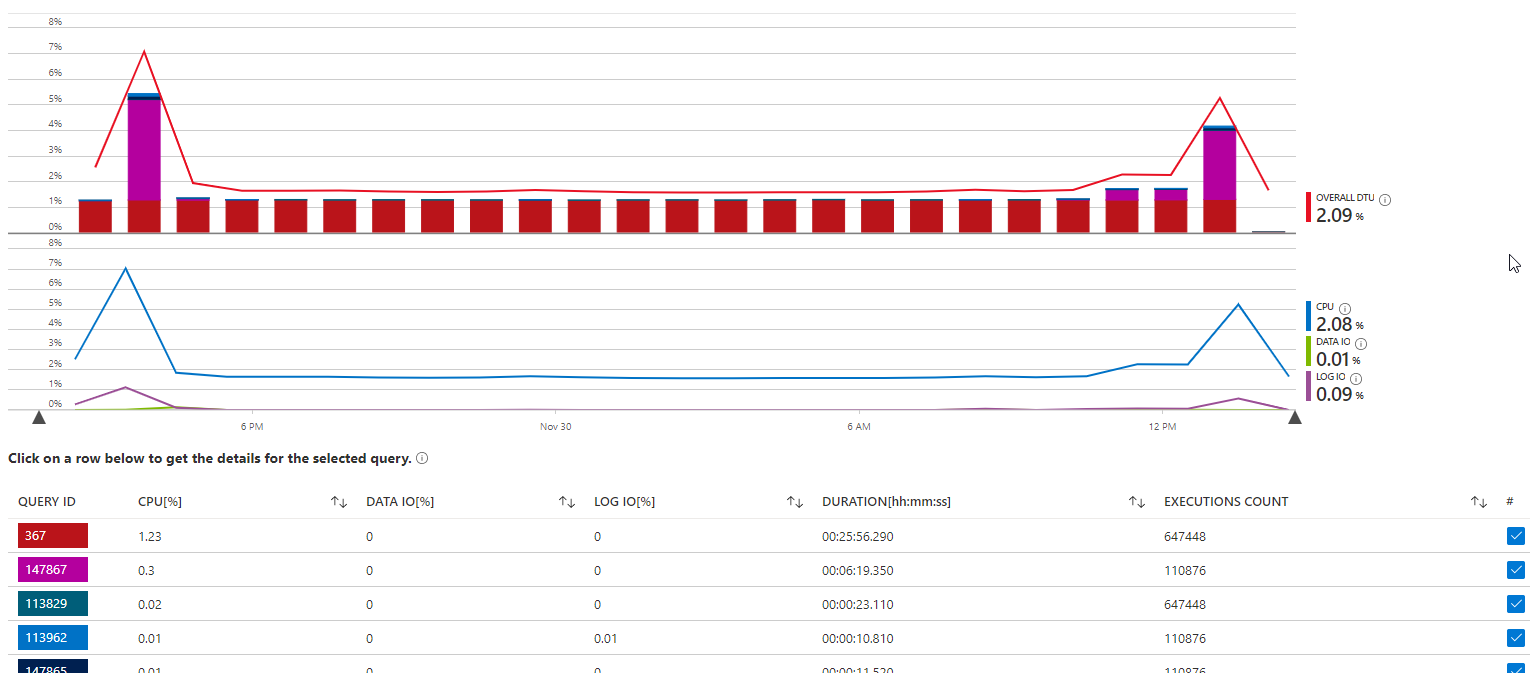


We have a situation where if we edit specific blocks, we see database cpu peaks and a non-responding admin UI
In logs we see that a specific query peaks on the database and if we follow application insight trace logs (epi is run on an app service in azure) for one of the requests from the admin UI we see a burst of sql server requests and also requests to epifind which seems to run in sequence making the response back to the frontend real slow.
The block is used on multiple pages, also on pages which are children to parents which also contains the block.
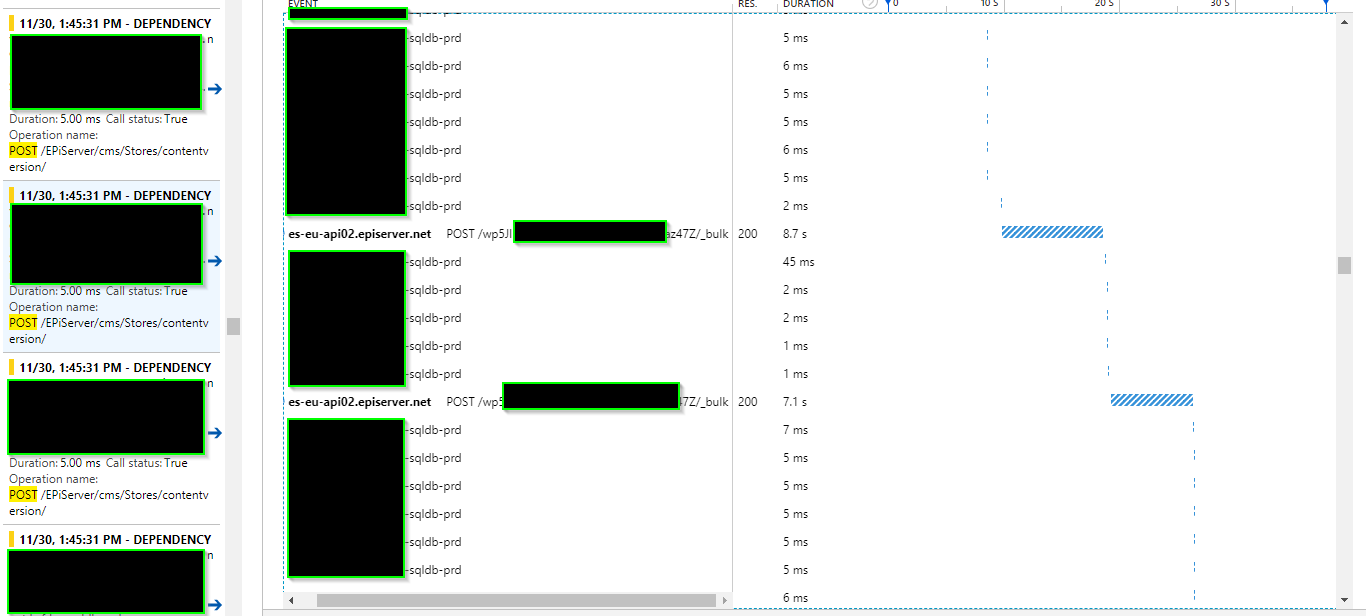
Below follod what we see in the browser Network trace (not all requests listed only those that has an abnormal response time):
To trigger the requests we edit in a field (XHtmlString tinyMCE) of the block and put focus in another field then these request fires:
POST https://*host*/EPiServer/cms/Stores/contentversion/
Response takes 1.2 minute
Automatically the this request is fired:
POST https://*host*/EPiServer/cms/Stores/contentdata/1911_81792
Response takes 1.2 minute
After these calls have returned the admin UI signals that "Publish" can be done. And we publish, then this request is made
POST https://*host*/EPiServer/cms/Stores/contentdata/1911_81792
This Response takes at least > 1.2 minutes (company proxy time outs)
Edit has been published though
In database logs we see this. HMM I cant upload images. You have to take my word for it. We see spikes from a particular query:
INSERT INTO @Result
SELECT
tblContentLanguage.fkLanguageBranchID AS OwnerLanguageID,
NULL AS ReferencedLanguageID,
tblContent.pkID AS OwnerID,
tblContentLanguage.Name As OwnerName,
tp.pkID AS ReferencedID,
tpl.Name AS ReferencedName,
2 AS ReferenceType
FROM
tblContent
INNER JOIN
tblContentLanguage ON tblContentLanguage.fkContentID=tblContent.pkID
INNER JOIN
tblContent AS tp ON tblContent.ArchiveContentGUID=tp.ContentGUID
INNER JOIN
tblContentLanguage AS tpl ON tpl.fkContentID=tp.pkID
WHERE
(tblContent.ArchiveContentGUID IN (SELECT PageGUID FROM @pages)) AND
tpl.fkLanguageBranchID=tp.fkMasterLanguageBranchID AND
tblContentLanguage.fkLanguageBranchID=tblContent.fkMasterLanguageBranchID
But this never gives any results as if we zoom into this part:
INNER JOIN
tblContent AS tp ON tblContent.ArchiveContentGUID=tp.ContentGUID
Looking at the actual values for all ArchiveContentGUID in the table they are all NULL and ContentGUID is never NULL. So, the join will as I understand sql queries :-p never return any results.
Ialso if we follow what happens after the application recieves the request
POST https://*host*/EPiServer/cms/Stores/contentversion/
(And possibly the other frontend requests mentioned above, have not checked)
We see that an massive amounts of requests to the database are performed but also stuck in between all those request are requests to epifind in sequence so that all in all it takes a superlong time to respond to the frontend
Anyone knows what is going on?