Performance Tuning and Optimization of EPiServer CMS
There are many factors to consider when tuning the performance of your EPiServer CMS site. This article deals with common pitfalls when optimizing EPiServer CMS for better performance.
EPiServer and Memory
First thing to check is that you have enough memory. EPiServer needs a lot of memory to cache the PageData object for each of all active pages on the site. The larger the site (more pages), the more memory you will need.
For very large sites, consider using Windows 64-bit edition that you can stack up with a lot of memory. This works with EPiServer CMS 5 SP1 and later but is not officially supported yet.
The DataFactory class will first check if the requested page or list of pages is in the cache when you call GetPage() or GetChildren(). If it is not in the cache, the page or list will be loaded from the database and added to the cache. The default implementation (read more about pluggable runtime cache) uses the ASP.NET built-in public cache to store pages and lists in memory.
The public cache in ASP.NET is also used to store other data in addition to EPiServer CMS PageData and Lists. Periodically, ASP.NET will use a Least Recently Used (LRU) algorithm to scavenge the cache for more space. If the memory pressure is very high, the lifetime of cached items can be very short or even zero (not added at all), which is not very good for the EPiServer CMS performance.
It is easy to see what’s inside your cache:
protected void Page_Load(object sender, EventArgs e)
{
    foreach (DictionaryEntry d in this.Cache)
    {
        Response.Write(d.Key);
        Response.Write(” - “);
        Response.Write(d.Value);
        Response.Write(“<hr>”);
    }
}
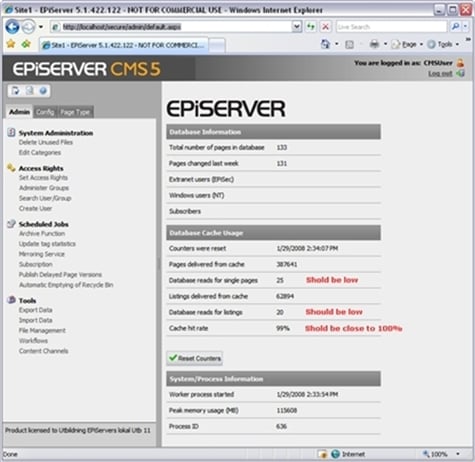
A very good indicator of memory issues is to look at some statistics from the DataFactory class. You can see the Cache Hit Rate if you go to admin mode, it should be close to 100% or maybe a few percent below (it is normal that it drops to zero when you restart the site but it should climb fast.) A constant low value indicates that you need more memory because PageData objects are then thrown out of the cache, and must be reloaded from the database.
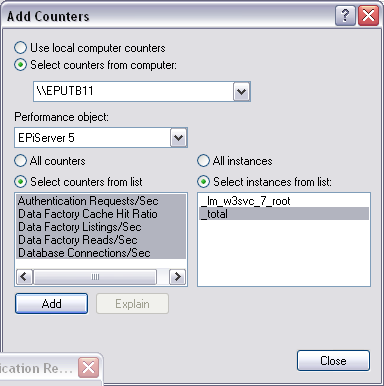
You can also see the Cache Hit Ratio and some other counters, through the Windows Performance Monitor. This is a good value to monitor in a hosting environment, and it is also wise to add an alert when the value becomes too low.
ASP.NET Worker Process / Application Pool
The maximum memory ASP.NET allows a worker process to consume before it is recycled, is by default 60% of the total system memory. Read more about memoryLimit tag.
<system.web>
<processModel>
<memoryLimit>60</memoryLimit>
</processModel>
</system.web>
Default Application Pool – do not use it and do NOT delete it (even if you plan to never use it). Create your own pool instead, but do not create one pool for each site on the Web server. Instead, consolidate your applications into one pool and only use a separate pool for troublesome Web applications. You must have separate pools for ASP.NET 1.1 and 2.0 applications though.
You can also configure the application pool to recycle if it consumes to much memory. If your worker process constantly recycles you need to find out why, because EPiServer CMS will always be a little bit sluggish after a restart (before data is cached again). You will also loose all in-process session data when the process restarts, which is an issue of its own.
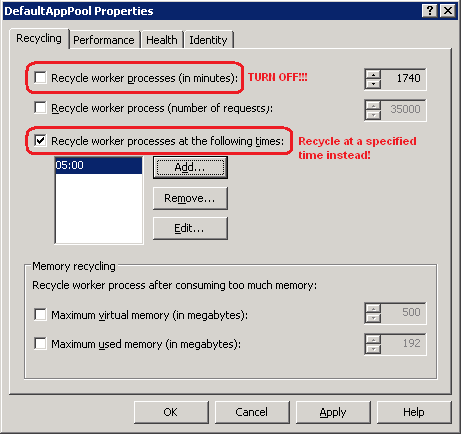
Settings: I recommend that you uncheck “Recycle worker processes (in minutes)” and use “Recycle worker processes at the following times” instead.
You should also uncheck “Shutdown worker processes after being idle...”. This is very important for EPiServer CMS sites with low traffic (for example during the night).
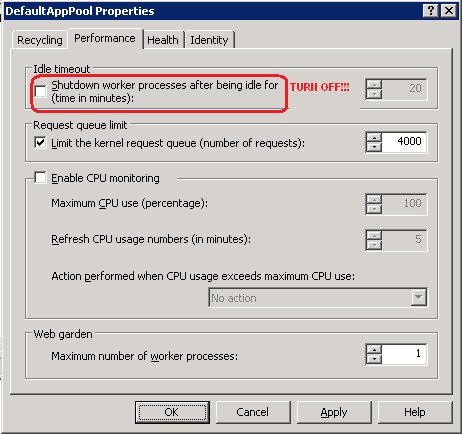
Do not use Web garden unless you know what you are doing! It will require double memory for the cache and out-of-process state-handling. If you change the number of worker processes from 1 to 2, it is like having two Web servers on the same box with IIS acting like load balancer (it is a cheap way in a development environment to test how you application will behave in a farm with load balancing).
EPiServer Scheduler
Be aware that your scheduled jobs are only initiated from the EPiServer Scheduler Service but executed inside the ASP.NET Worker Process. Jobs processing a large amount of pages in an ineffective manner (like the Mirroring Job that loads every version of every page below the root page every time it is executed), will increase the memory pressure and push out other resources from the cache.
If you enable memory recycling, you can end up in a situation where the job will be aborted every time, because you reach the limit and the ASP.NET Worker Process is killed and restarted. It is also important that you do not schedule jobs so that they are running at the time when you specify that the worker process should be recycled.
MSSQL Server and EPiServer CMS
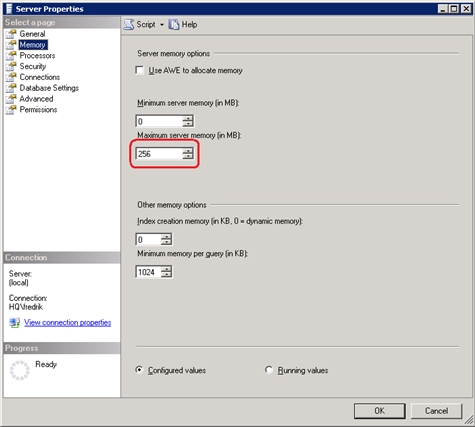
It is best practice to have two machines, one for the Web server and one for the database. But sometimes you have to run the database on the same machine as the Web server. If you do, it is important to remember that the MSSQL Server competes with the Web server for resources such as memory. You should always limit the amount of memory the database can use, because it is better for EPiServer CMS to have data cached in the Web application than in the database.
Usually the usage of the database is low (around 5% CPU) in EPiServer CMS scenarios, because EPiServer CMS tries to cache what it needs in the Web application. If you have a higher usage of the database, this can be an indication showing that caching isn’t working as it should in the Web application, but it could also indicate that something else is wrong in the coding of your templates.
Other Processes
Finally, do not forget to use the ordinary task manager to check if you have other processes that compete for memory on your Web server.
More About Performance and EPiServer CMS
How to Use Language Manager for Best Performance (FAQ)
Performance Issues and Out of Memory Exception (FAQ)
