Load testing EPiServer with LoadStorm
Stress testing is an important tool in your toolbox, and with the cloud it has gotten easier and cheaper than ever to do. In this blog post I will show you how you can load test your EPiServer site using a cloud based tool called LoadStorm.
The importance of stress testing early
This info graphic from Altom shows the relationship between when a bug is found and the cost to fix it. And the lack of performance is definitely a bug, so the earlier you can stress test and resolve any performance issues, the better (and cheaper!).

Ok, so you have a solution you want to performance test. Now what?
It used to be extremely expensive to do a performance test. You would need a bunch of machines acting like visitors, you needed a server to run the site and you would need a dedicated network between them to prevent any “contamination” of the results by other traffic on the same network.
The cloud to the rescue
Thanks to the almighty cloud we can now set up a complete performance test in 10 minutes, and have it automatically run during the night so we can have some nice results to analyze in the morning.
In Making Waves we use a tool called LoadStorm that lets you set up a test script (how the virtual visitors navigate the site, submits forms etc.), run it with up to 100,000 concurrent users (we usually use up to 500) and give you stats to analyze.
Step 1: Sign up for LoadStorm
LoadStorm offers a free (forever) account that gives you up to 25 concurrent users. It is a good way to get started, but you need more if you want to really test a site (we usually use 500 concurrent users, and that costs about $100/month for unlimited tests)
Sign up here for the free account
Step 2: Building a test plan
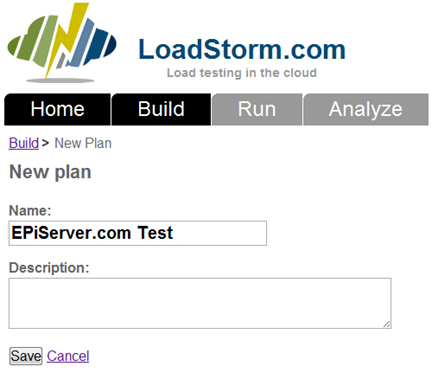
Click on the “build” tab and click the “Add plan” button. Give it a name and click “Save”.
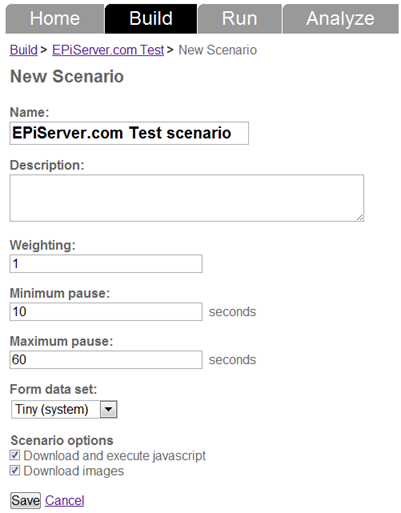
A plan consists of several “scenarios” that consists of several “steps”. e.g. someone clicking on the “contact me” link on the front page and submits the contact form would be one scenario consisting of 3 steps.
Lets add this scenario to our test plan:
Now click “Save” and on the next page click “Add step”.
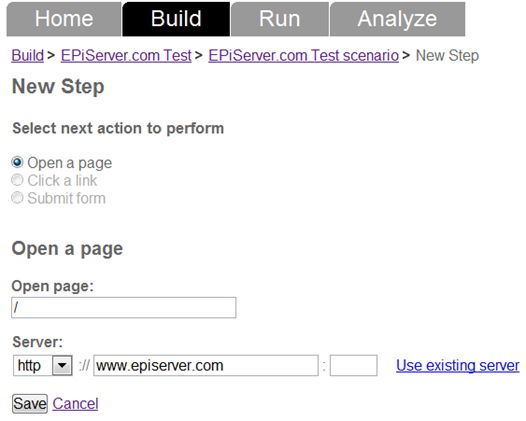
1. Visiting the front page
We want to open the front page so we choose “Open a page” and set the page to “/”. Click “Save”.
2. Clicking on the “contact me” link
Click “Add step”. Choose “Click a link”. LoadStorm will now download your front page and provide you with a list of links on the page that can be clicked. Choose the “Contact me” link. Click “Save”.
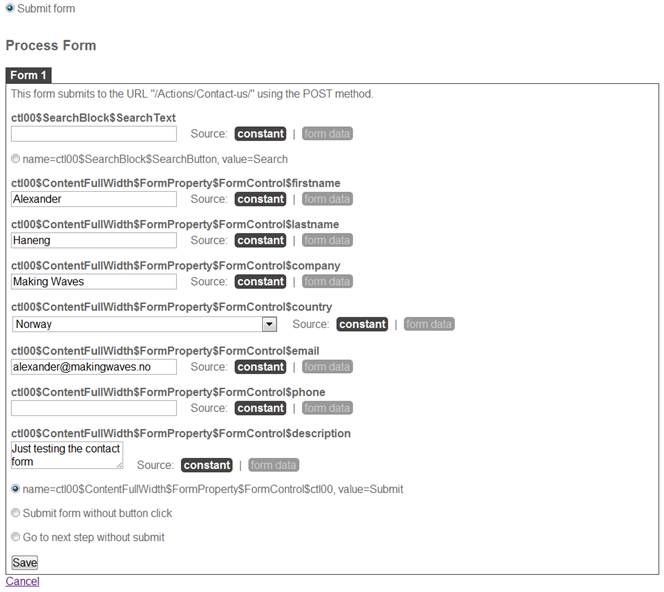
3. Submitting the contact me form
Click “Add step” and then select “Submit form”. LoadStorm will now download the page and provide you with all the form fields. Fill them inn and choose how you wan to submit the form.
Our scenario is now complete. Click to go back to your scenario.
Verifying your server
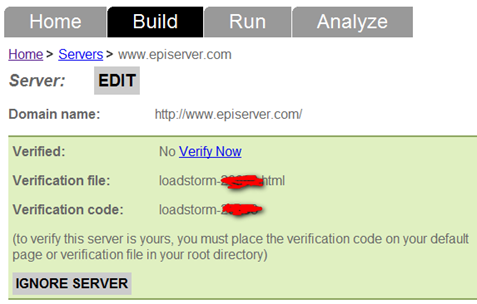
You will now see a list of servers that is being tested in your scenario. To be able to test a server you first need to verify it (if not you could potentially use LoadStorm as a DDOS attack tool). To verify a server simply click the “Verify” button. You will now get a page with a file name loadstorm-xxxxx.html. You need to create a file with this name on the root of your site so that LoadStorm can verify that you are the owner of the site.
Step 3: Run your test
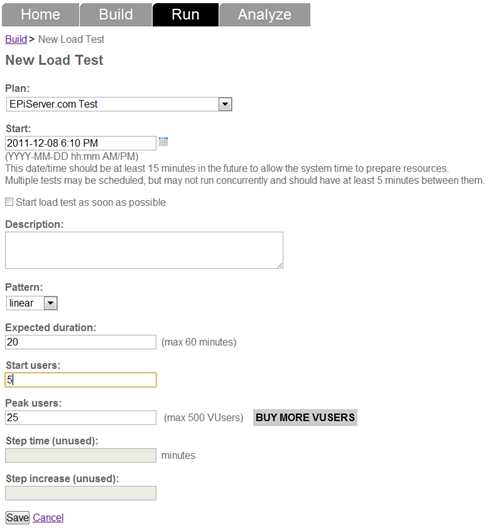
Click the Run tab and click “Add load test”. Choose the plan you just created, set the time for when you want the test to be run (and how long), and how many concurrent users you would like and how you want the traffic to increase (we want to test the application until it breaks, so we need to start small and scale up)
Step 4: Analyze the results
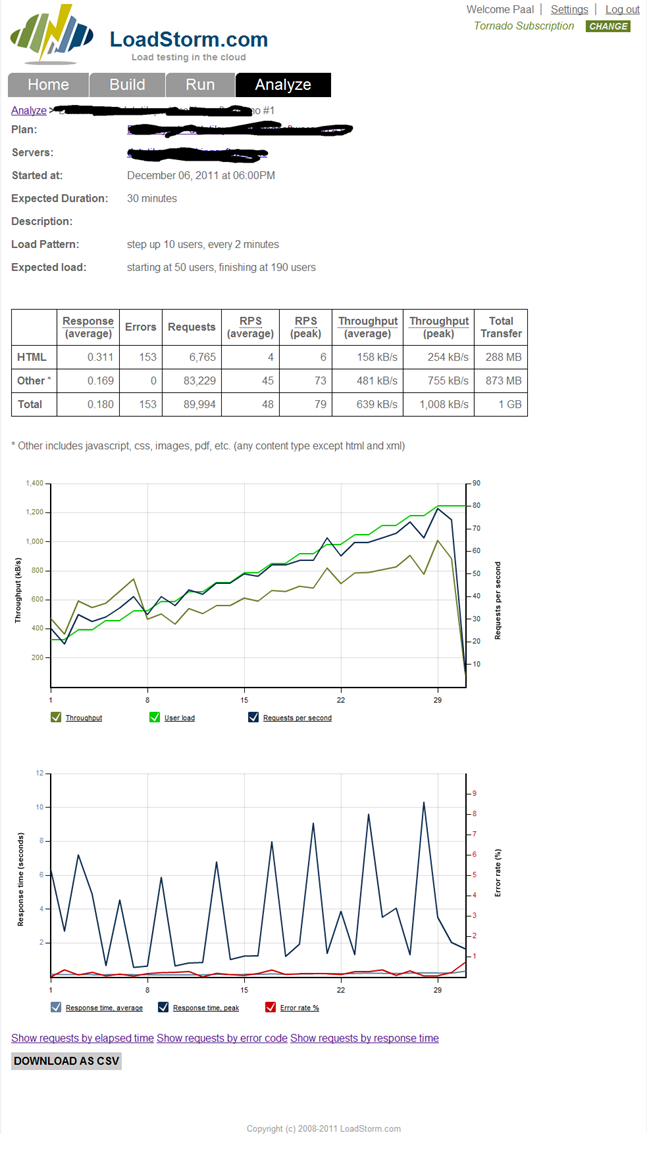
Once LoadStorm has run your test you will get a test report like this:
The key performance indicators to look at is average response time as the load increases and the number of errors. If you start seeing a lot of 5xx errors then you know that your application is breaking under the load. In the report above you see that not even 190 concurrent users can break it (I have scheduled a new test with 500 users later today). The spikes in the lower chart can be ignored since further investigation shows that they are anomalies not caused by the application.
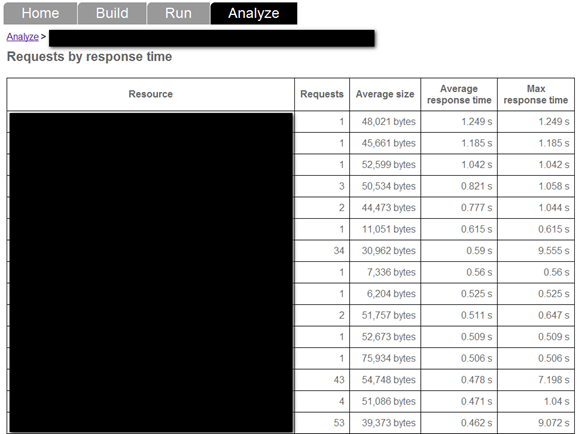
Clicking the bottom 3 links will get you detailed information about average load times for individual pages and files at 1 minute intervals as well as error messages.
Final thoughts
With tools like LoadStorm you no longer have any excuses not to use load testing as part of your standard testing procedures. And it will save you from a lot of pain later on since you avoid getting some performance issues months or years down the line due to some trivial performance bug.
Of course once you have located a performance problem there are other tools to narrow down the cause, but that is the topic for a future blog post. ![]()
Posted by Alexander Haneng


Great post! Can't wait to try this out :)
Another useful tool for this is BrowserMob https://browsermob.com/performance-testing. You can record selenium scripts through the Firefox plugin and then import the scripts into browser mob to run load tests. You have various options and can run real user or virtual user tests.
BrowserMob costs $1,499/month for 500 virtual users, LoadStorm $199/month :-)