Debugging a 64-bit dump of a 32-bit managed process
You may wonder: why on earth would you want to do that? Well, on 64-bit machines, 32-bit processes are run using a WOW64 compatibility layer to provide the 32-bit process with the appropriate entry-points and map them to the 64-bit equivalents.
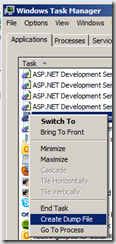
 However, when you use Windows Vista's (and later) Create Dump File, you will create a dump of the process that includes the WOW64 compatibility layer. The dump file thus contain both 64-bit and 32-bit code.
If you open this dump in WinDbg (x64), it seems to load just fine. Then, to start managed debugging, you will want to load the debugging extension SOS. A convenient command to load the correct version of SOS (which must be the same version as the version of .NET Framework that you intend to debug) is to type the command
.loadby sos mscorwks
into the WinDbg command window. This will load SOS.dll from the same directory on your local machine, as mscorwks.dll was loaded from (in the debugee). (Note that you will need to exchange mscorwks with clr to debug a .NET4 debugee)
However, in this case you will get errors such as:
0:000> .loadby sos mscorwks
The call to LoadLibrary(C:\Windows\Microsoft.NET\Framework\v2.0.50727\sos) failed, Win32 error 0n193
    "%1 is not a valid Win32 application."
Please check your debugger configuration and/or network access.
There is some interesting information we can derive from this error message. Since the path (C:\Windows\Microsoft.NET\Framework) points to the 32-bit version of SOS.dll, the mscorwks.dll in the dump must also be a 32-bit binary (the 64-bit version of .NET Framework is in the Framework64 folder). And since we're running the 64-bit version of WinDbg and we try to load a 32-bit SOS, we will need to start a compatible version of WinDbg instead.
Reopening the dump in WinDbg (x86) and loading the SOS managed debugging extension works just fine. However, you will find that it doesn't work when you issue any of the SOS commands: !CLRStack, !DumpHeap, !EEStack:
0:000> !clrstack
Failed to load data access DLL, 0x80004005
Verify that 1) you have a recent build of the debugger (6.2.14 or newer)
            2) the file mscordacwks.dll that matches your version of mscorwks.dll is
                in the version directory
            3) or, if you are debugging a dump file, verify that the file
                mscordacwks_<arch>_<arch>_<version>.dll is on your symbol path.
            4) you are debugging on the same architecture as the dump file.
                For example, an IA64 dump file must be debugged on an IA64
                machine.
You can also run the debugger command .cordll to control the debugger's
load of mscordacwks.dll.  .cordll -ve -u -l will do a verbose reload.
If that succeeds, the SOS command should work on retry.
If you are debugging a minidump, you need to make sure that your executable
path is pointing to mscorwks.dll as well.
Drats!
There's a workaround for this, though. Issue the command
0:000> !wow64exts.sw
Switched to 32bit mode
And voila!
0:000:x86> !clrstack
OS Thread Id: 0x1b40 (0)
Failed to start stack walk: 80070057
Another failure...
However, other commands have started to work! Among them EEStack which prints the stack trace for all active threads, with managed and unmanaged code interleaved. This will have to do.
If you're able, capture dumps of 32-bit processes with a 32-bit debugger such as the 32-bit ADPlus part of the x86 version of Debugging Tools for Windows.
Happy debugging!

I've been waiting for this blog. Great to have on epi world.