
Demystifying CMS & Commerce Cache Memory Usage
We occasionally receive questions or escalations to support regarding the memory usage of Optimizely CMS and Customizable Commerce applications. They are questions along the lines of "why is it using so much memory" or "do you have a memory leak".
TL;DR: Your application pushing the server up to 90 % memory utilization isn't necessarily a problem. It is likely by design - we put that memory to work!
In-memory Caching and its Benefits
We use SQL server to store the structured data in CMS and Commerce (and Blob storage for assets/binaries). SQL server is a very high performance system for this type of application and we have developed quite efficient usage of it over the years. But just like any other separate system it just cannot compete with in-process memory access, which may be several orders of magnitude faster. On the other hand, while memory is cheaper than ever, it is still more expensive than persistent storage (which ultimately backs a database). So we don't have unlimited amounts of it.
But, assume that in a given period, a small subset of all data (pages, products...) will be accessed much more frequently than other data, following a 80/20-like or exponential drop-off distribution. By that characteristic, we can dramatically decrease the number of calls to the database by keeping just that smaller subset of the total data in memory instead of fetching it from the database every time it is requested. This is how in-memory caching can improve performance quite dramatically even if it only holds a subset of the total data.
Cache Memory Usage
So we basically want cache as much of the frequently accessed data that the available memory allows us to. But we cannot let it grow without bounds, or the application will run out of memory. Also, the cache is less important than the memory allocated to do actual processing in the application (like serving requests), so we want to make sure there is always some headroom to do that. So we trim (or compact) the cache to keep memory usage under control. We aim to keep memory usage at or below a certain percentage limit of the total available memory, currently the default is 90%.
If that limit is hit, the cache will be trimmed to evict some fraction its items, starting with the least recently used (LRU) items until the trim target is met. The most frequently accessed items will remain in the cache (unless, of course, they are expire or are evicted because they are changed).
Interaction with Garbage Collection
However, for the memory held by cached objects to actually be freed up, they also have to be colleted by the .NET Garbage Collector (GC). So for this reason the cache trimmer always waits for a full GC run before it trims again. We leave the timing of the GC to the .NET runtime, which means you might not see an immediate reduction in memory usage after the cache has been trimmed. But generally it will happen soon after because the GC also sees that the application is under memory pressure (and we actually piggyback on the GC:s memory metrics for determining the memory load).
Cache Growth and Trim Cycle
After the cache is trimmed there will eventually be requests for items not in the cache (cache misses), items which will then be put into the cache after being read from the DB. So the cache starts growing again, but not necessarily containing the same items (LRU, remember). What happens over time depends on the application and the data. Most applications will probably go through peridical cache trims with periods of cache growth in between, looking something like in the image below (with three separate instances):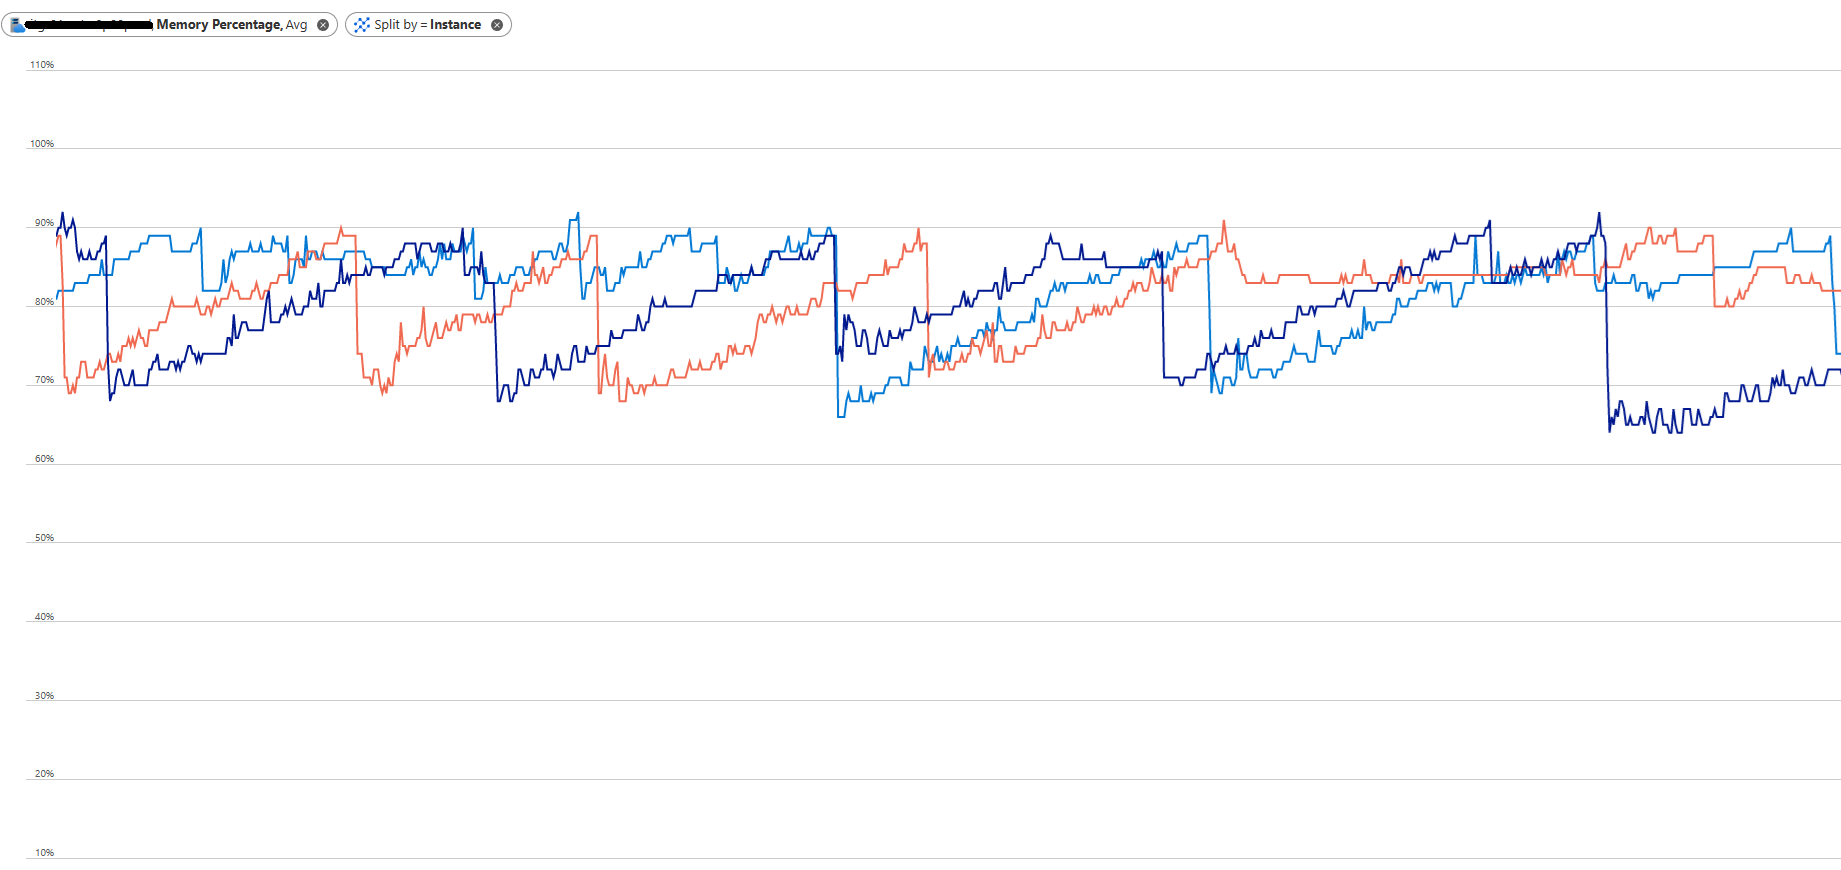
Conclusion and Next Steps
As you have probably gathered by now, high memory consumption in a CMS/Commerce application isn't a bad thing in itself. It is probably doing its job and making the best use of the memory you have made available to it.
That said, it shouldn't run out of memory. Now that you know more about the cache trimming, configuration of memory thresholds and interaction with the GC you are also better equipped to troubleshoot other memory issues. If the memory grows beyond the configured threshold for the in-memory cache, there is likely something else in the application leaking memory. A few additional hints that may help you troubleshoot (applicable to CMS 12 and above):
- Configure logging on the Information level for the namespace EPiServer.Framework.Cache. You will be able to see messages for what memory pressure the cache trimmer sees, and what actions it determines from it.
- You can adjust the configured limit for the cache down to use less memory. But remember that it is still dependent on Garbage collections to actually free up memory, and the runtime may not do a full GC until it is under memory pressure.
- Using a memory profiler and/or analyzing memory dumps is of course a good way to figure out what is using up your memory.
> If that limit is hit, the cache will be trimmed to evict some fraction its items, starting with the least recently used (LRU) items until the trim target is met. The most frequently accessed items will remain in the cache (unless, of course, they are expire or are evicted because they are changed).
Frequently used and recently used sounds different to me - first one can be "10 000 usages in the last hour, last use 5 mins ago", and second can be "2 usages in the last hour, last time two seconds ago".
So just out of interest, is it a number of uses, or just the last usage time?
You're right, that wasn't consistent. The least recently used items are trimmed, the most recently used items are kept. Though I think it is safe to assume that least recently used and least frequently used/accessed have a big overlap in most cases.