")
Extending Application Insights in an Optimizely PaaS CMS Solution
As part of a recent Optimizely DXP project, I needed richer telemetry from the Content Delivery API than the default Application Insights integration provides. The aim was to capture custom properties such as content IDs and cache status so that we could slice and query API performance in more detail. Here is the approach I took.
Creating a Custom Telemetry Processor
The first step was to create a custom 'ITelemetryProcessor' implementation to enrich telemetry for Content Delivery API requests. This processor inspects each telemetry item, checks whether it relates to the Content Delivery API, and then adds custom properties such as 'ApiType', 'IsOptimizelyApi', and the extracted 'ContentId'.
public class ContentDeliveryApiTelemetryProcessor(ITelemetryProcessor next) : ITelemetryProcessor
{
    private readonly ITelemetryProcessor _next = next;

    public void Process(ITelemetry item)
    {
        if (item is RequestTelemetry requestTelemetry &&
            IsContentDeliveryApiRequest(requestTelemetry.Name))
        {
            requestTelemetry.Properties["ApiType"] = "ContentDeliveryApi";
            requestTelemetry.Properties["IsOptimizelyApi"] = "true";

            var contentId = ExtractContentIdFromUrl(requestTelemetry.Url?.ToString());
            if (!string.IsNullOrEmpty(contentId))
            {
                requestTelemetry.Properties["ContentId"] = contentId;
            }
        }

        _next.Process(item);
    }

    // Helper methods to identify API requests and extract IDs omitted for brevity
}
Register the processor with Application Insights in 'startup.cs' or the Program configuration so that it runs for every request.
Adding Request and Response Logging Middleware
To go further, I introduced a middleware component to log the full request and response cycle for API calls. This middleware captures request and response bodies, headers, and timing, and sends a single 'RequestTelementry' entry to Application Insights with custom properties such as cache status.
Below is a reduced example focusing on adding custom properties to a tracked request:
public class RequestResponseLoggingMiddleware(RequestDelegate next, TelemetryClient telemetryClient)
{
    private readonly RequestDelegate _next = next;
    private readonly TelemetryClient _telemetryClient = telemetryClient;

    public async Task InvokeAsync(HttpContext context)
    {
        // … capture request/response details …

        var telemetry = new RequestTelemetry
        {
            Name = $"{context.Request.Method} {context.Request.Path}",
            Url = new Uri($"{context.Request.Scheme}://{context.Request.Host}{context.Request.Path}{context.Request.QueryString}"),
            Duration = stopwatch.Elapsed,
            ResponseCode = context.Response.StatusCode.ToString(),
            Success = context.Response.StatusCode < 400
        };

        telemetry.Properties["ApiType"] = "ContentDeliveryApi";
        telemetry.Properties["IsOptimizelyApi"] = "true";
        telemetry.Properties["CacheStatus"] = cacheStatus;
        telemetry.Properties["RequestHeader_UserAgent"] = context.Request.Headers["User-Agent"];

        _telemetryClient.TrackRequest(telemetry);
    }
}
Register the middleware in 'Startup.cs':
app.UseMiddleware<RequestResponseLoggingMiddleware>();
And configure logging levels in 'appSettings.json:
"Logging": {
  "LogLevel": {
    "Default": "Warning",
    "Cms.Infrastructure.Middleware.RequestResponseLoggingMiddleware": "Information"
  },
  "ApplicationInsights": {
    "LogLevel": {
      "Default": "Information"
    }
  }
}
This approach provides structured, queryable telemetry for each Content Delivery API call.
Example Output
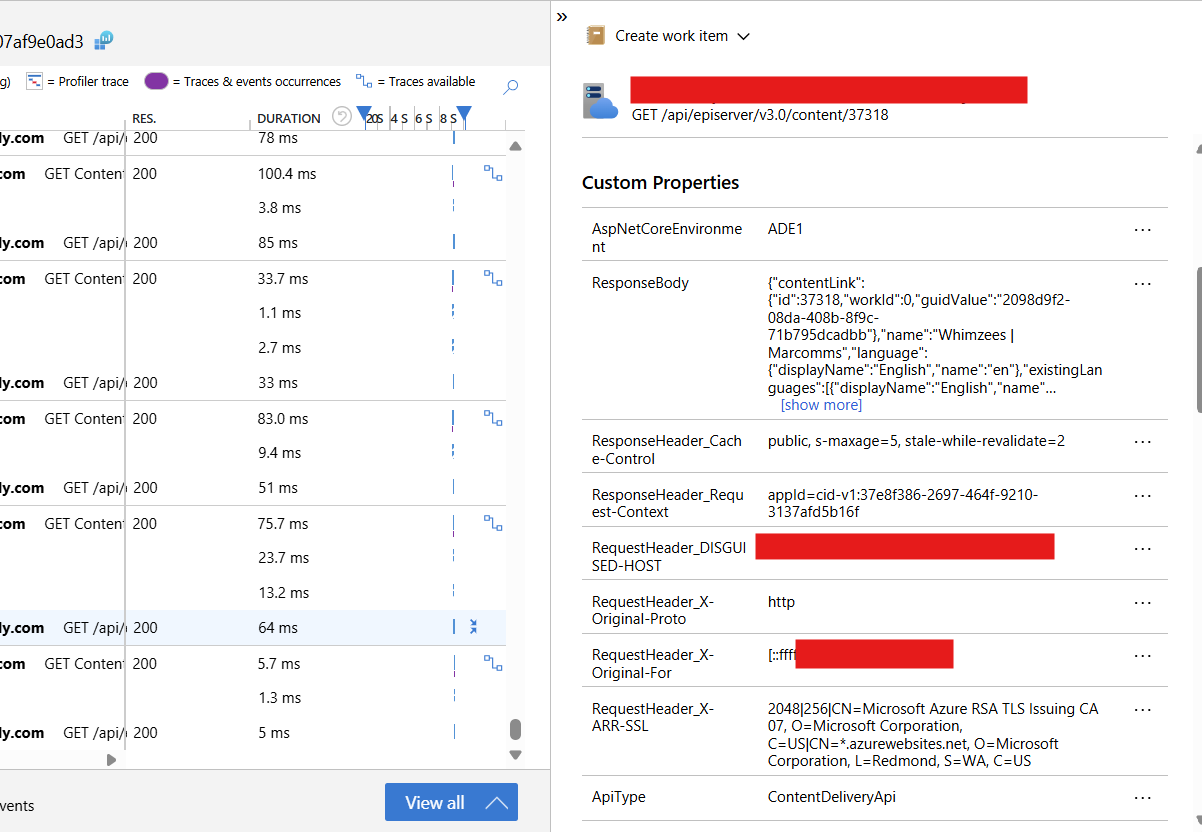
Benefits of Extended Telemetry
Extending telemetry offers several practical advantages:
-
Deeper diagnostics: You can quickly isolate performance bottlenecks, such as slow content retrieval or cache misses.
-
Better observability: Custom properties allow you to group or filter requests by content item, making it easier to identify patterns.
-
Operational insight: Logging cache status and request headers reveals how your CDN, edge caching, and client applications interact with the CMS.
In large Optimizely solutions, where API calls power multiple front ends, this level of detail is invaluable for proactive monitoring.
Comments