Request Monitor Gadget
The idea behind this gadget is to be able to pinpoint slow pages and see activity on the site. Then analyze why these pages takes long time to load. You can also on specific pages see all requests to compare performance of the site to earlier. The gadget will show activity for the day with updates every 20min.

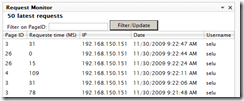
Shows 50 latest requests to the site with page id, request time, ip, date and username if logged in. You can filter on Pageid, if thextbox is empty it will just refresh table.
Shows the 50 slowest pages with page id and average request time for it. Here you can also search by page id to get data for specific pages.
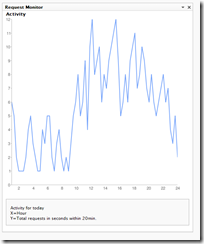
Shows activity for today over 24h. With all requests grouped within 20min. Google chart is used.
Configuration will let you empty all data.
Installation
Download the install package and install it with EPiServer Deployment Center.
You will also have to update web.config also with the http module that listens to PreRequestHandlerExecute and PostRequestHandlerExecute to capture request times.
Add to <httpModules> (IIS6) and <Modules> (IIS7):
<add name="RequestModule" type="RequestMonitorGadget.Modules.RequestModule, RequestMonitorGadget"/>
Download


Sweet gadget Sebastian
Nice, and you where able to get it out before todays deadline =)
Super work Dost!