System Monitor Gadget
Here’s our contribution to the Gadget Contest. This gadget is developed by me (Björn Sållarp) and Erland Ranvinge, both working at Avantime.
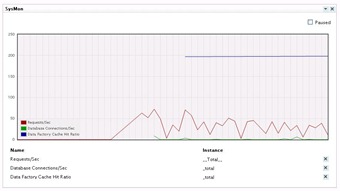
The gadget enables you to read performance counter values from the machine running the web application. The counter values are updated in real time and visualized in a graph using the Awesome flot plotting plugin for jQuery.
The plugin is intended to give system administrators a quick and easy way to check the server status without having to remote to the server and start PerfMon.
Counters are visualized in this fancy chart.
You can choose from all the available counters on the machine and the settings are stored uniquely for each gadget instance in the new dynamic data store available in EPiServer 6.
Download the gadget here:
Download the source here:


To bad someone already have made this gadget:
http://world.episerver.com/Blogs/David-Knipe/Dates/2009/11/Local-and-remote-system-monitor-gadget/
;-)
I don't mind having different ways of doing the same thing. Now you can choose the best option for your need. For example this uses jQuery so you dont need the external reference to google charts and such. Its just for the judges to decide which is found the best from the competition point of view. I have not looked that deep on the 2 options so I have no opinion yet on which is best, just no problem with 2 of the "same" gadget I would say. =)