


Your weekly experiment report is one slash (/) away with Mark
How to build a reusable report skill in Mark for Optimizely Web Experimentation.
I want to share something with my fellow CROs. I love using Mark with Optimizely Web Experimentation because it makes those time-consuming tasks much easier. You know the ones: monotonous, boring, and they drain your week.
Weekly reporting is a pain for most experimentation teams. We all know it. Here’s how I made it easier.
At a glance
What it does: Turns one experiment ID into a one-page A4 report.
Who it is for: Brands that run tests in Optimizely Web Experimentation.
What you need: A Mark account where you can add skills, and an experiment ID.
Time: A few minutes to set up. Seconds to run.
What you get
The report has a section for each brand. Each section shows control versus variant, the lift for every metric, and a short analysis. At the bottom, there's a box with the next steps.
My favourite rule is the colour code. A lift only turns green or red when it reaches 90% confidence. Anything below that stays grey. No more celebrating a 3% lift on a tiny sample.
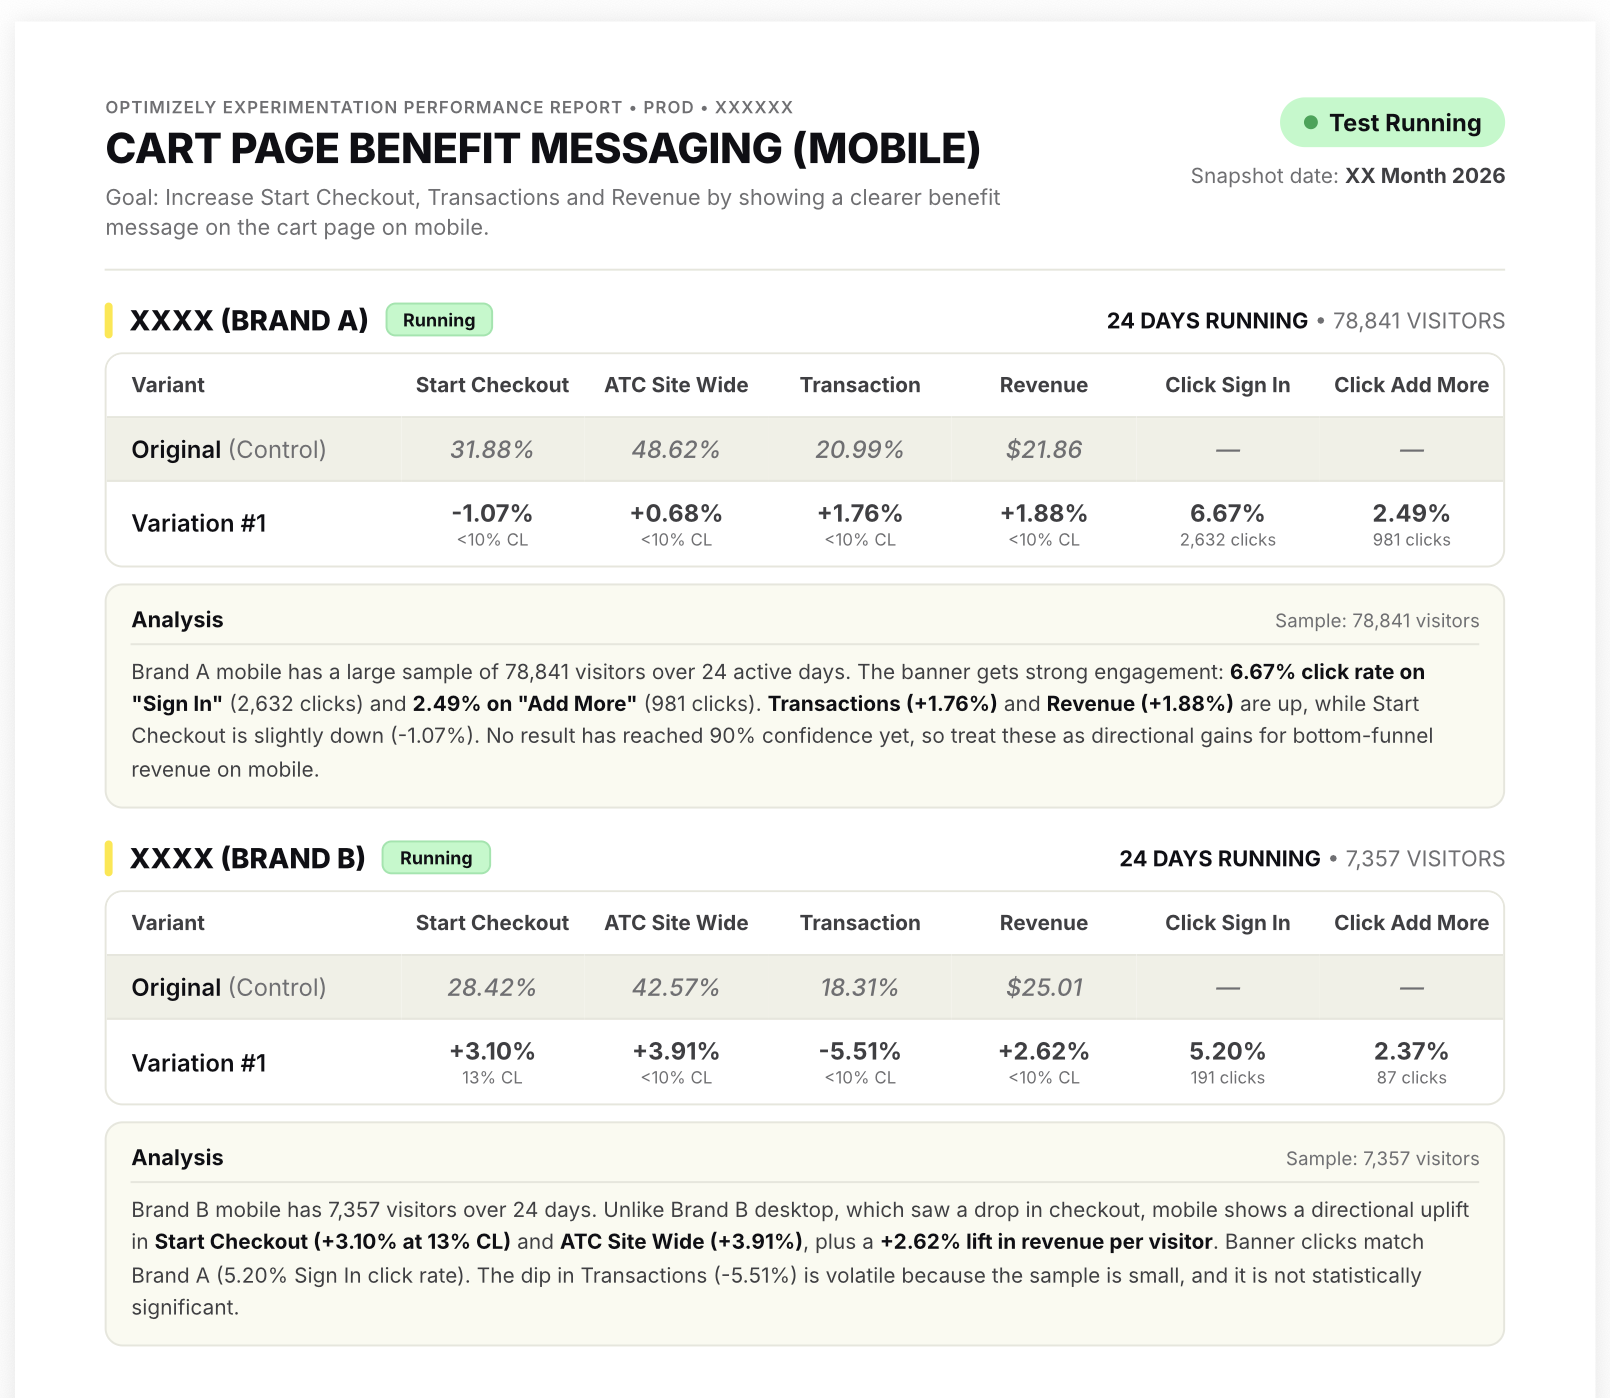
Image: One-page A4 experiment report with a results table for each brand, an analysis box and a Next steps block.
Before you start
- Copy the skill file text below.
- Find every XXXX. Replace each one with your own brand name, short name and Optimizely project ID. The XXXX is loud on purpose. It is hard to miss, so nobody sends a client a report that says XXXX.
- Check your access. Organisation skills need the right permission. No access yet? Choose Personal when you build the skill, then ask your admin to share it later.
The last step of the skill uses two Mark tools, write_content_to_file and convert_to_pdf, to save the report and turn it into a PDF. If Mark cannot find them, ask your admin to switch them on.
Build it in Mark
The skill form has a handful of fields. Here is what I put in each one.
Prefer to chat? Ask Mark to "Help me create a skill" and it fills in the form for you. Then check each field against the steps below.
1. Open Skills and add a new skill
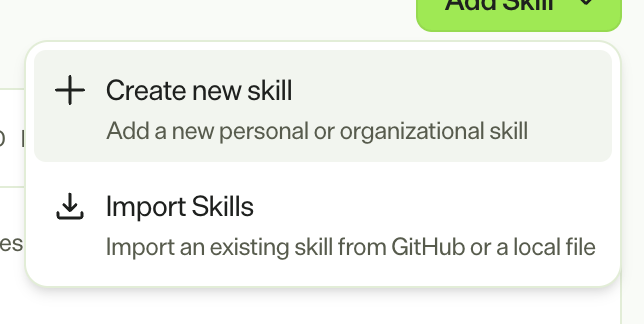
In Mark, go to Context and choose Create new skill.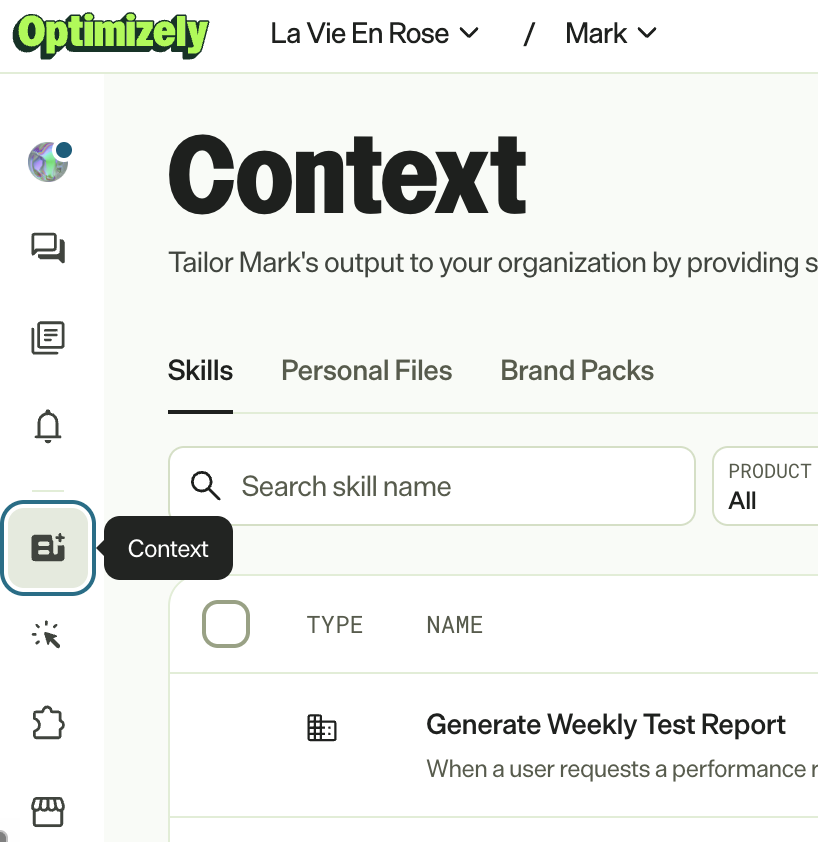
then
2. Name your skill
Type Weekly Experiment Report in the Name field. Keep it plain. Your whole team will see it in a list.
3. Add a shortcut
Type weekly-experiment-report in the Shortcut field. Mark shows the slash version under the box. A green Available means nobody has taken it. This is what you will type in chat.
Keep the Active switch on, at the top right, so Mark can use the skill.
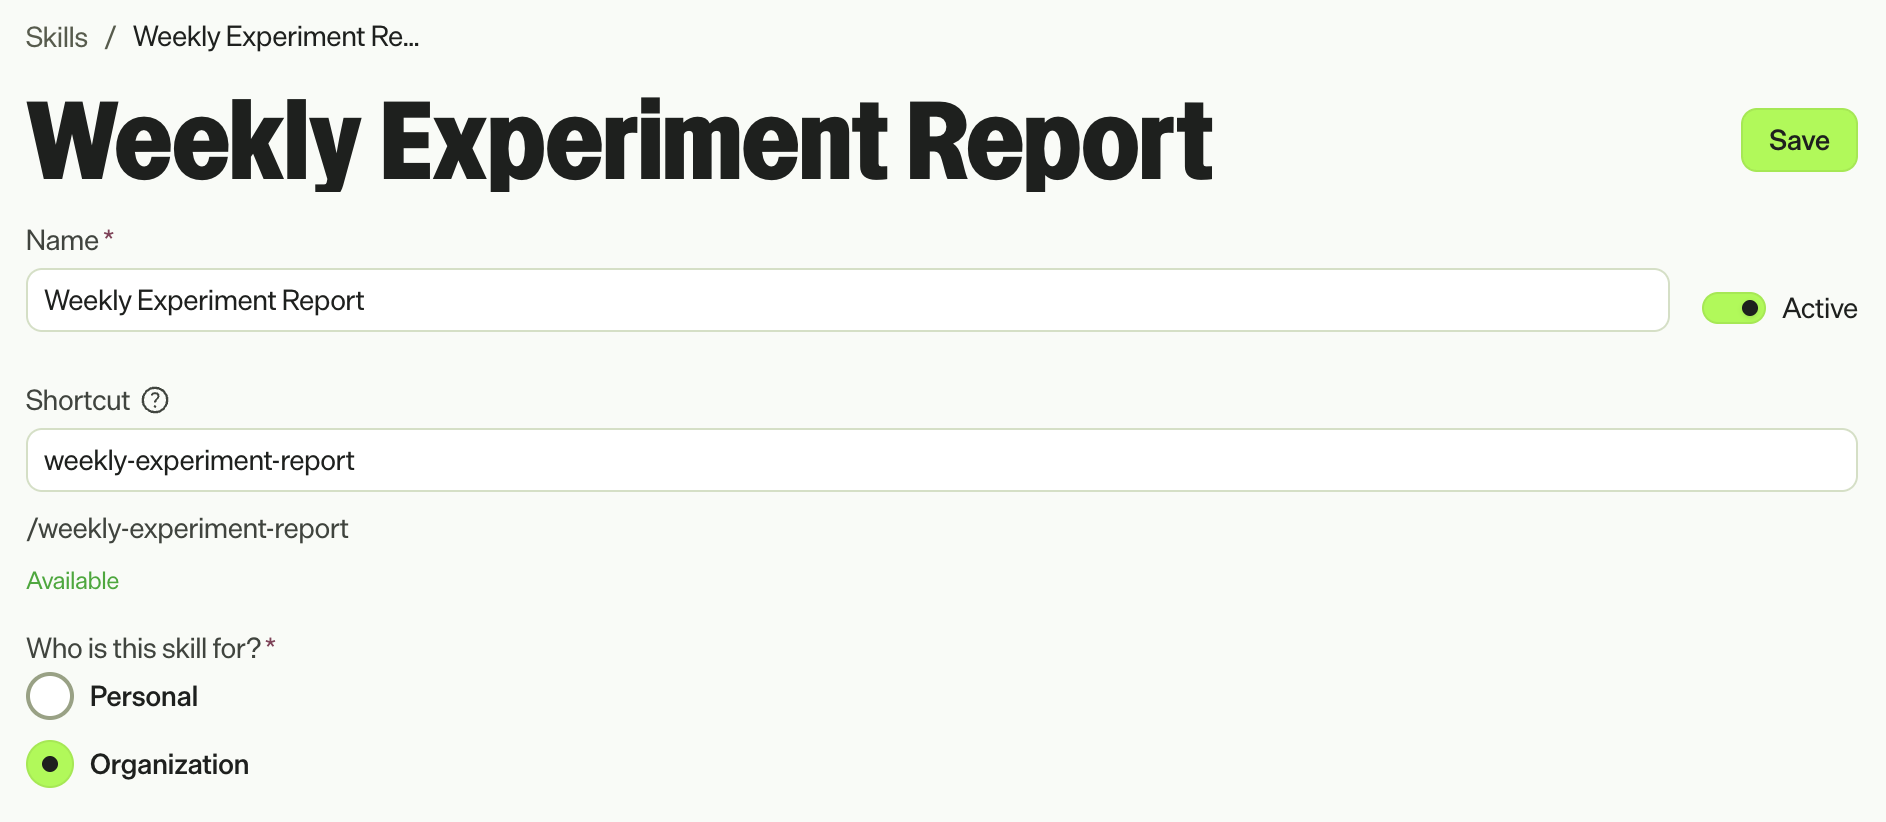
4. Choose who it is for
Pick Organisation to share it with your team. Pick Personal to keep it to yourself while you test.
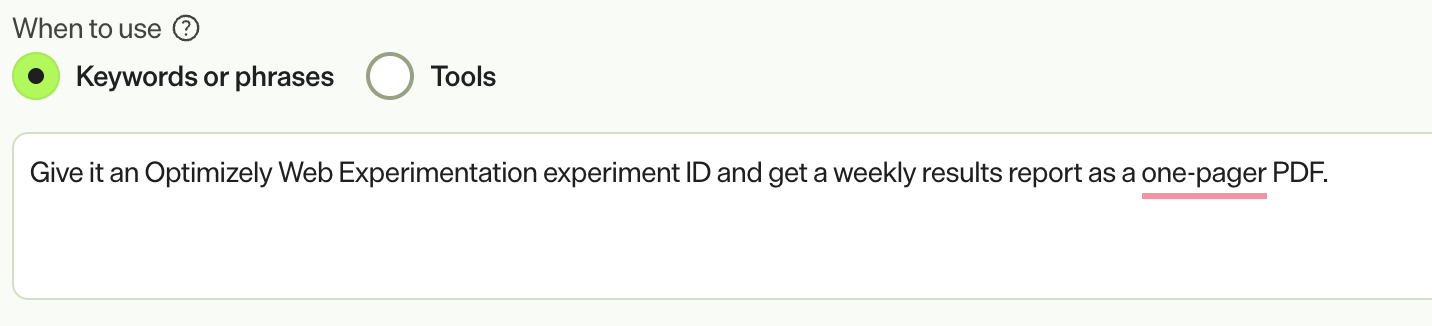
5. Say when to use it
Keep Keywords or phrases selected under When to use. Then add one sentence about the job. Here is mine.
Give it an Optimizely Web Experimentation experiment ID and get a weekly results report as a one-pager PDF.
Mark uses this to decide when your skill fits. Write it the way your team would ask.
6. Paste the core skill
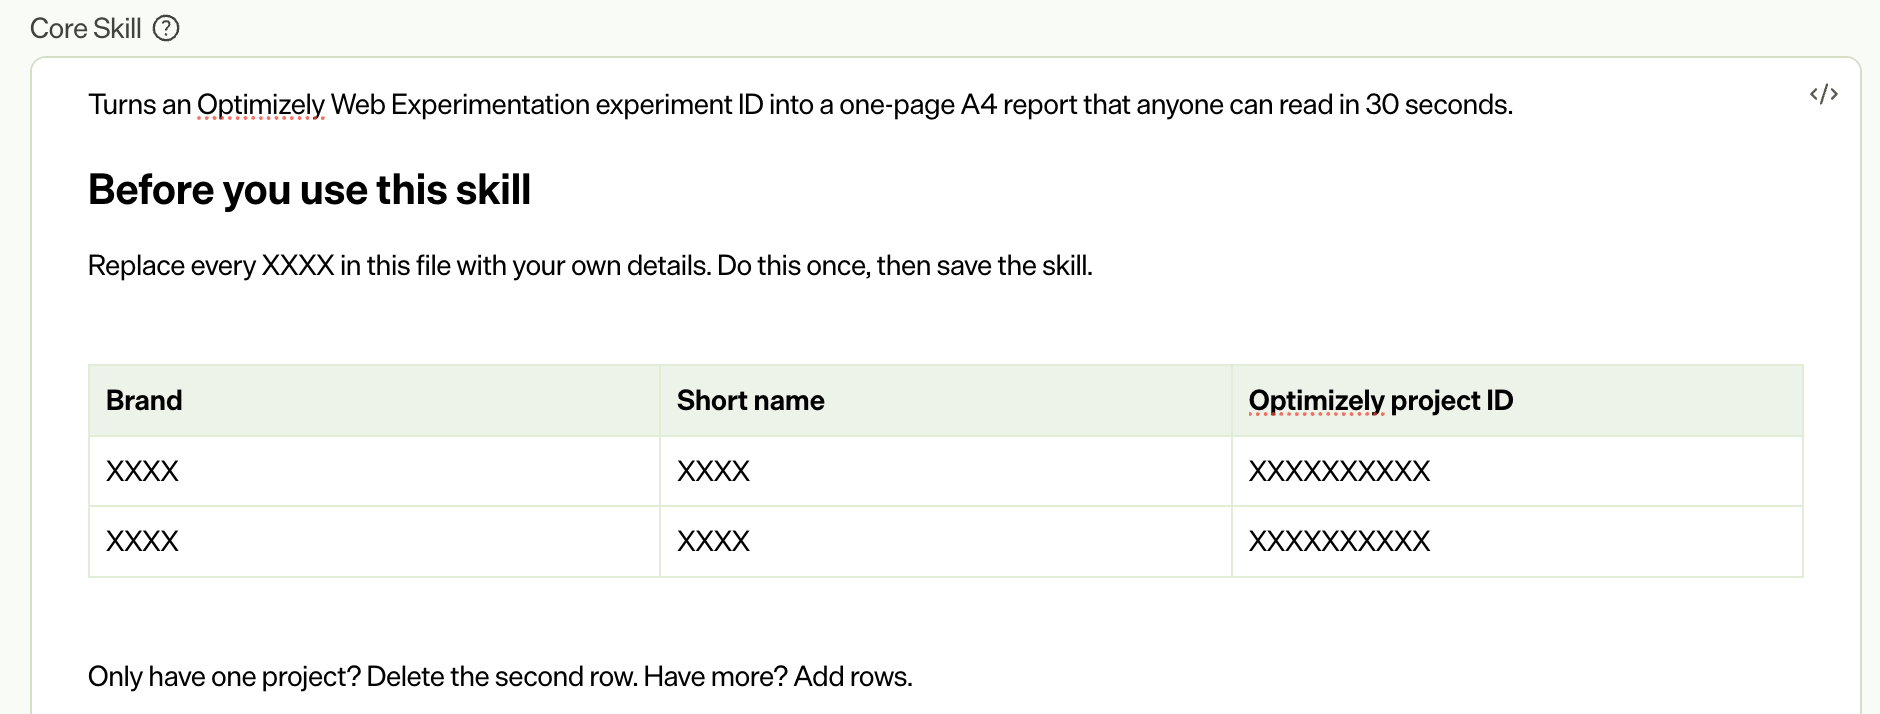
Copy the skill text from your download or from the end of this post. Paste it into Core Skill. Start at the line that begins "Turns an Optimizely Web Experimentation experiment ID". Leave out the title and anything above it, because the Name field already does that job.
At the top of the skill you will see the XXXX table. Fill it in now.
7. Skip tags and files
Tags and Files are optional. I left both empty.
8. Pick your product
Scroll down to Where to use. Choose Experimentation in the Product drop-down. Choose All in Instance to use the skill on every instance, or pick one. Need another product? Use the plus button to add a row.

9. Save
Click Save. Your skill is ready to use.
Try it
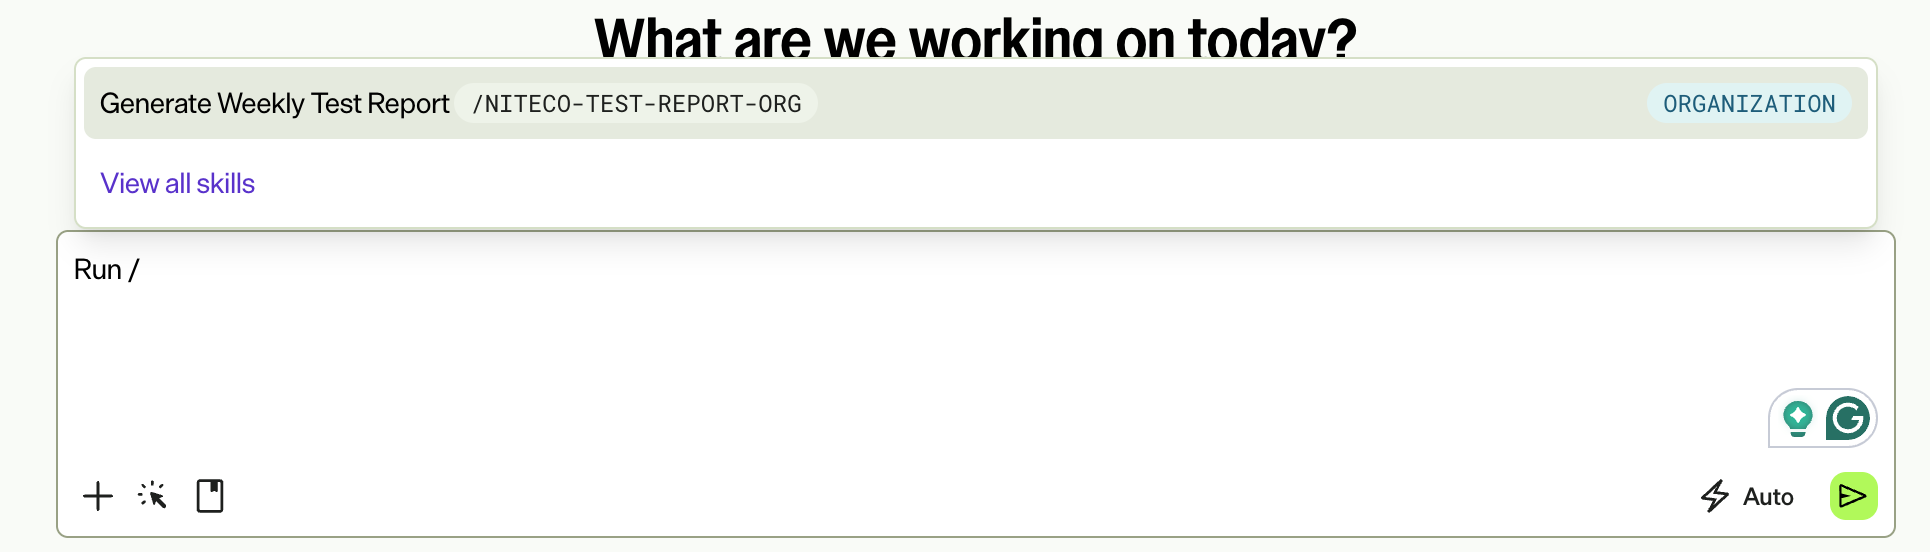
Open a new chat with Mark. In the Ask Mark box, type / and pick Weekly Experiment Report from the list. You can also type /weekly-experiment-report. Then give Mark your experiment ID. Forgot it? Mark will ask.
Mark finds the experiment results directly from the Optimizely Web Experimentation tool, builds the report and gives you a PDF link.
Check the numbers against Optimizely the first time you run it. The skill tells Mark never to make up a number. If a value is missing, the report shows n/a. A quick check still pays off.
Make it yours
Everything in the skill is plain text, so you can change it.
- Brands. Swap the XXXX rows for your own. Only one project? Delete a row.
- Colours. My report uses Niteco inspired colours. The skill lists every hex code, so change them to match your brand.
- Rules. The 90% confidence rule lives in the skill. Want 95%? Change the number.
- Metrics. Add the metrics your team cares about. The tables take up to six.
Change one thing at a time and run the skill again. That way you know what made the difference.
The full skill
Here is the core skill, ready to copy. It starts at the line you need for the Core Skill box, so you can paste it as it is. Remember to replace every XXXX first.
-- !!copy and paste this!! --
Turns an Optimizely Web Experimentation experiment ID into a one-page A4 report that anyone can read in 30 seconds.
Before you use this skill
Replace every XXXX in this skill with your own details. Do this once, then save the skill.
| Brand | Short name | Optimizely project ID |
|---|---|---|
| XXXX | XXXX | XXXXXXXXXX |
| XXXX | XXXX | XXXXXXXXXX |
Only have one project? Delete the second row. Have more? Add rows.
Steps
1. Gather inputs
- Ask for the experiment ID or test name if the user has not given it.
- If anything is unclear, ask before you start. This includes metrics, segments, the snapshot date, or whether to use another source such as GA4 instead of Optimizely.
- Ask one thing at a time.
2. Get the experiment data
Look for the experiment in each project in the table above. Use whatever access you have: the Optimizely Experimentation API, a connector, or an export.
Pull this for each brand:
- Total visitors
- Days running. Count active days only and leave out any paused periods.
- Control rate for each metric
- Variant lift and confidence level (CL) for each metric, per segment (All users, Desktop, Mobile)
- Clicks and click rate for any banner or button metrics
- Test status
- Snapshot date, which is the day the results were pulled
Rules:
- Never invent or estimate a number. If a value is missing, show "n/a" and tell the user.
- If the experiment sits in one project only, make one brand block.
- If the test targets one device only, show one control row and one variant row. Skip the other segments.
3. Build the HTML report
Make one A4 portrait page with Tailwind CSS and the Inter font.
Page: width: 210mm; min-height: 297mm; padding: 10mm 12mm. Use a flex column so the Next Steps block sits at the bottom of the page.
Header
- Small grey label: "Optimizely Experimentation Performance Report", then the environment and experiment ID.
- Test name in bold capitals.
- Goal in grey below the name, in one sentence.
- Snapshot date on the right.
Colours
The report uses Niteco inspired colours. Swap them for your own brand colours if you like. In Tailwind, use arbitrary values such as bg-[#F0F0E6].
| Use | Colour | Hex |
|---|---|---|
| Page background | White | #FFFFFF |
| Main text | Niteco black | #0F0F14 |
| Muted text | Grey | #6F6F72 |
| Accent (brand bar, highlights) | Niteco yellow | #FFE628 |
| Soft panels and highlight rows | Warm grey | #F0F0E6 |
| Borders | Warm grey | #E6E6DC |
| Good news | Signal green | #19A550 |
| Bad news | Red (outside the Niteco palette, kept for clarity) | #E11D48 |
Use one accent colour at a time and keep the page mostly white.
Status badge
A rounded badge at the top right. It shows the overall status:
- Test Running: light green fill
#B9FAC8, dark text#0F0F14, green dot#19A550 - Test Paused: light yellow fill
#FFF8BE, dark text#0F0F14, yellow dot#FFE628 - Test Ended: warm grey fill
#E6E6DC, dark text#0F0F14, grey dot#6F6F72
Brand blocks
Give each brand its own block.
- Vertical yellow bar (
#FFE628) on the left of the brand header. - Brand name in bold capitals.
- Small status badge next to the name, in the same colours as the status badge above: Running, Resumed or Variant Won (green), Paused (yellow) or Ended (grey).
- Right-aligned traffic details: "24 DAYS RUNNING • 78,841 VISITORS".
Tables
- One column per metric. Use up to six.
- Balance the column widths so no header wraps onto more than two lines. Watch long names like "Successful Account Creation".
- "All users" row: warm grey background (
#F0F0E6). - Control row: grey italic text (
#6F6F72). - Winning variant row: soft green background (
#B9FAC8at about 45% strength). - Under each lift, show the confidence level in small grey text, for example "<10% CL".
Lift colours
| Confidence level | Positive lift | Negative lift |
|---|---|---|
| 90% or higher | Green (#19A550) |
Red (#E11D48) |
| Below 90% | Dark grey (#3F3F43) |
Dark grey (#3F3F43) |
Below 90% CL, always use neutral grey, even when the lift looks big.
Analysis box
- Warm off-white background (
#FAFAF0) with a thin#E6E6DCborder. - Bold "Analysis" title with a bottom border line. Show the sample size on the right of the title.
- Write 3 or 4 short sentences. Start with the result, then give the sample size, then the main risk.
- Below 90% CL, call a result "directional". Do not say "won" or "significant".
Next steps block
- Niteco black background (
#0F0F14), white text, yellow heading (#FFE628) and yellow bullet dots. - Two or three bullets. Each one starts with a bold action, then one sentence on why.
- Choose from actions like: Continue running, Conclude in X weeks, Roll out the winner, Pause, Re-test with changes, Roll out on one device only.
4. Check before you save
- The report fits on one page. Nothing is cut off, including every Next Steps bullet.
- Every number matches the source data.
- Lift colours follow the 90% rule.
- No placeholder text is left in the report.
5. Save and convert to PDF
- Save the compiled HTML file with the
write_content_to_filetool. Use a clean file name, for exampleA4_Report_[Test_Name].html. - Pass the file download link to the
convert_to_pdftool. - Share the PDF link with the user.
6. Reply to the user
Share the PDF link and add two or three lines on the result. Tell the user about any missing data or numbers you could not check.
-- !!end of copy and paste!! --
Final thoughts
A skill like this will not replace your judgement. It takes away the copy and paste, so you can spend your time on what the numbers mean.
Try it, then tell me what you would add. A new metric? A different colour rule? I would love to see your versions.
Happy testing and reporting,
Polly
How can Niteco help you?
Niteco is the largest global Optimizely partner and Optimizely AI Innovator of the Year and Mark AI Preferred Partner. Our vast team knows CMS, Commerce, CMP, ODP, Experimentation and the Optimizely Agentic Platform inside and out.
|
Number |
What it means |
|---|---|
|
#1 |
Optimizely's largest global partner |
|
400+ |
AI-trained experts, certified across Optimizely, Microsoft, Contentful and Adobe |
|
2000+ |
Successful projects delivered |
|
9 |
Optimizely MVPs, the largest team of them |
Want help with your upgrade, migration, commerce or experimentation plans? Or want to get more out of Mark and the Optimizely Agent Platform? Get in touch with Niteco and let's talk.
Comments