A critical vulnerability was discovered in React Server Components (Next.js). Our systems remain protected but we advise to update packages to newest version. Learn More.
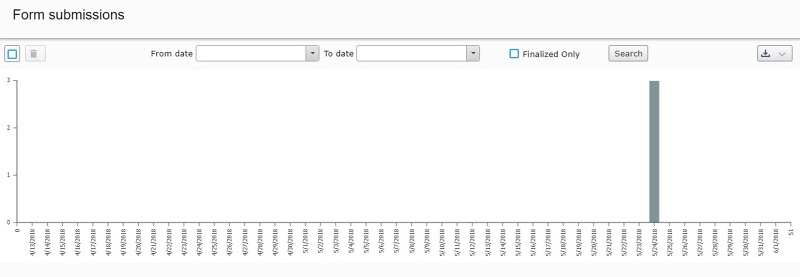
View submissions as list instead of graph
Forms only support to display that kind of view as default. If you want to display in other formats, you should write your custom view where you can display your data in your specified format. See FormData.js as a sample code for render a custom view.
Jun 04, 2018 12:46
You don't want to show the graph, do you? In that case you need some tweak to hide it. Am I missing something?
Jun 04, 2018 13:02
The problem is not whether the graph is shown or not. The problem that only the graph is shown. No table with the records is shown.
Jun 04, 2018 16:03
It should show both grid and graph. Please check the browser console if there is any js error. Maybe Forms conflict with your custom code.
Jun 05, 2018 9:17


When viewing forms submissions they are displayed as a timelined graph. How do I change view to a list like form submissions previously have been displayed? Running Episerver.CMS 11.5.1 and Episerver.Forms 4.9