View DXC Cache Status Easier In DevTools
When running on the DXC Episerver uses https://www.cloudflare.com/ for it's CDN caching to increase performance.
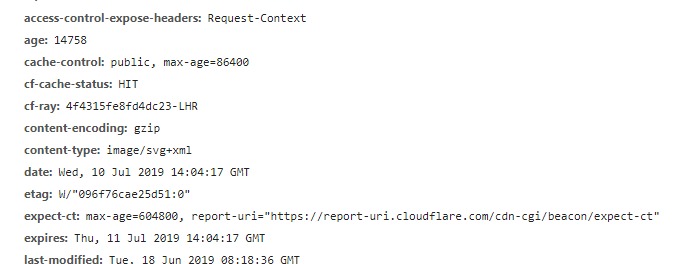
As most should know when viewing a request in DevTools you can open the request in DevTools and look at the headers and check cf-cache-status to check if a resource has been cached by checking for a HIT response.
We can then look at the cache cache-control header to see for how long e.g. public, max-age 86400 is cached for 24 hours with a HIT to say it's cached.

However it's a bit of a pain to have to click in to all of these, so let's use a not as well known feature of being able to add custom headers to the network requests panel.
Step 1.
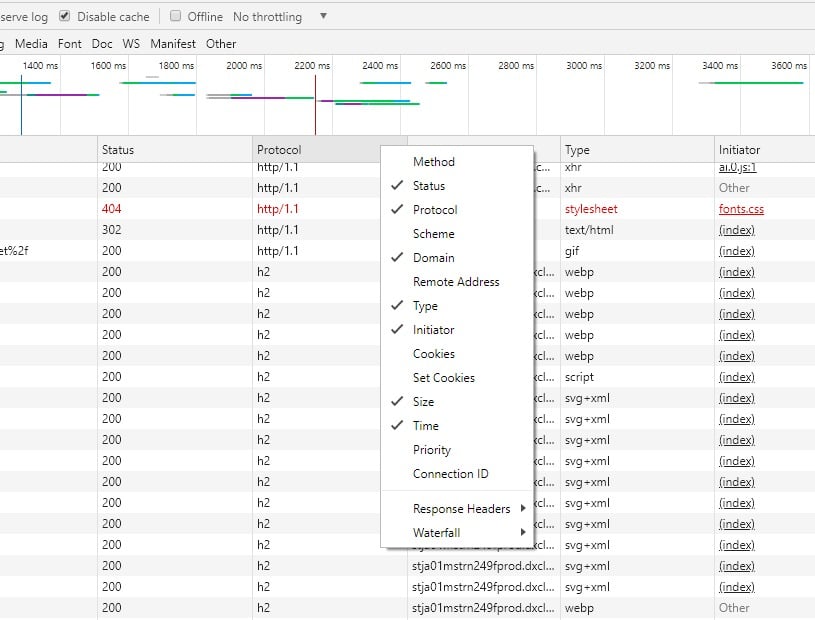
In network on DevTools right click the headers area as such

Step 2.
Navigate to Response Header -> Manage Custom Headers
Step 3.
Add in the header cf-cache-status which indicates if it's been cached
Result
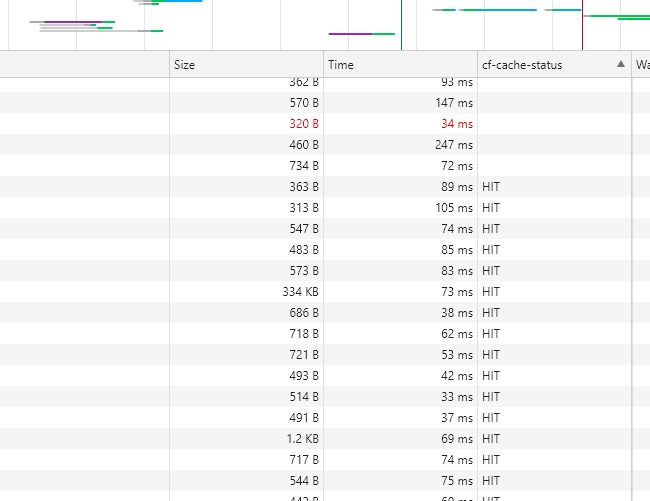
Now you'll see a HIT or MISS or Empty (If not going through CloudFlare) giving a lot easier way to see if your resources are being cached.

Easy :-)

Nice and simple tip, Scott. 👍
That's useful thanks for the tip!
Very helpful tip 👍