


Supercharging Optimizely DXP Troubleshooting with the Azure Copilot Observability Agent
If you’ve logged into the Azure portal recently to check the Application Insights for your Optimizely DXP environment, you might have noticed a new toggle in the Logs UI labelled simply: "Agent." And as you create a new query, being prompted with help from the Observability Agent
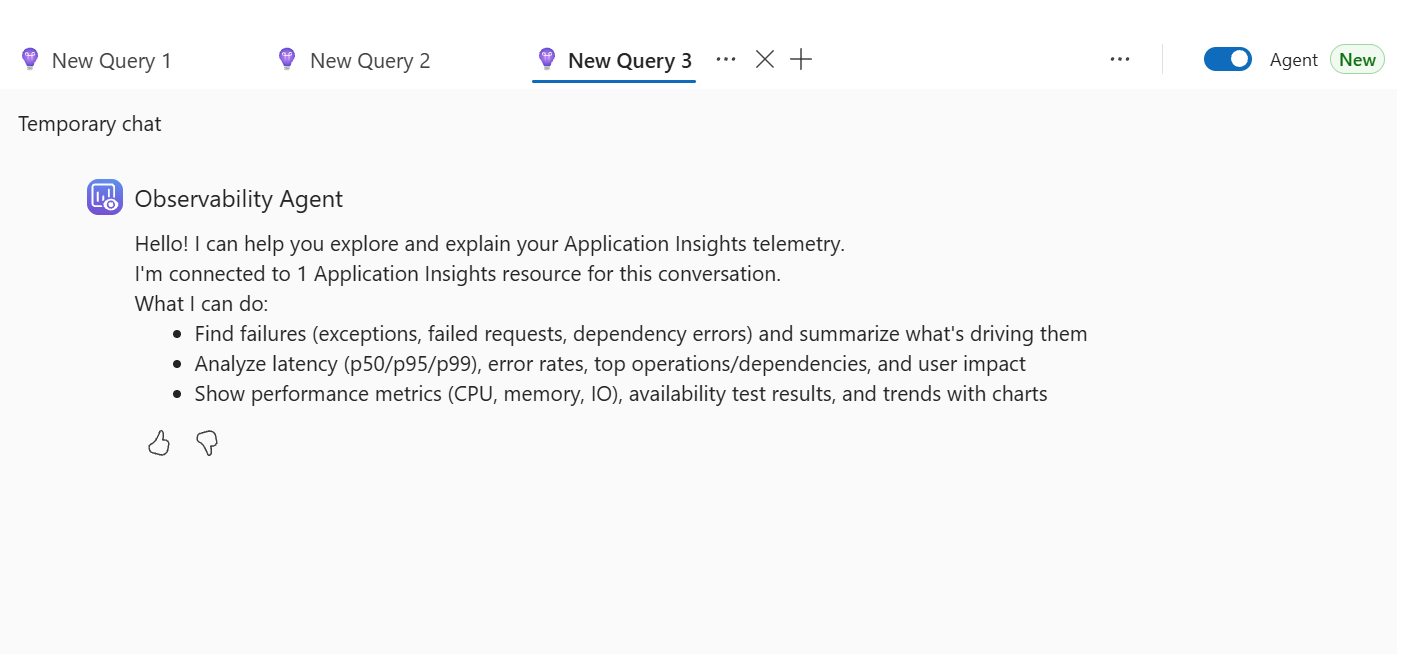
Application Insights gives us many very useful tools, including recent updates such as Grafana dashboards that can help us view key information about our application. We technical specialists in the Optimizely DXP stack should be familiar with working within the investigate, monitoring, and usage areas.
However, one key pain point has been working with and remembering Kusto Query Language (KQL) but with recent updates in Application Insights and this default enabled on the Optimise DXP, this can now be a lot easier.
Instead of writing complex Kusto Query Language (KQL) to figure out why your modern Optimizely Commerce 15 checkout is dragging, or why your CMS 12 editors are experiencing slow load times, you can now ask plain-English questions.
In this post, we’ll explore how to leverage this AI agent specifically for web apps running on Optimizely DXP, focusing on the exact types of telemetry, anomalies, and performance metrics that matter most for modern CMS 12/13 and Commerce 14/15 solutions.
The Modern Optimizely DXP Telemetry Landscape
Before we talk to the AI, we need to understand the data. Optimizely DXP environments (Integration, Preproduction, Production) automatically wire up Application Insights. For applications running on modern .NET (like CMS 12/13 and Commerce 14/15), this captures:
- Requests: Server-side ASP.NET Core page loads, Content Delivery API calls, and Optimizely Graph queries.
- Dependencies: SQL Database queries, external API calls (payment gateways, ERPs), and internal Optimizely services.
- Exceptions: Server-side errors and handled exceptions.
- Custom Events: Business logic milestones captured via TelemetryClient.
Historically, correlating a spike in Exceptions with a slowdown in Dependencies required mastery of KQL join statements. Now, the Observability Agent handles the translation. Let's look at how this plays out across the platform.
Scenario 1: Debugging Commerce 14/15 Checkout and Asynchronous Operations
Optimizely Commerce 14 and 15 fully embrace asynchronous programming. A modern checkout process involves validating a serialised cart, recalculating promotions, calling an external tax API, communicating with a payment provider, and finally using SaveAsPurchaseOrderAsync() to convert the cart.
If conversion rates drop, the culprit is often a silent performance degradation in one of these external or asynchronous steps.
The Old Way (KQL)
To find the average duration of the order saving operation over the last 24 hours, you’d have to write:
dependencies
| where name contains "SaveAsPurchaseOrder" or name contains "IOrderRepository.SaveAsync"
| where timestamp > ago(24h)
| summarise AvgDuration = avg(duration), Count = count() by bin(timestamp, 1h)
| render timechart
The Copilot Way
Toggle the "Agent" switch to On and simply type:
"Show me a timechart of the average duration for dependency calls related to IOrderRepository.SaveAsync over the last 24 hours, grouped by hour."
What to Look For in Commerce 14/15:
When using the agent, focus your queries on the known bottlenecks of a modern e-commerce platform:
- Cart Serialisation Latency: Commerce 14/15 stores active carts as JSON in the SerializableCart table. Ask the agent: "Are there any SQL dependencies related to the SerializableCart table taking longer than 500ms today compared to yesterday?"
- Third-Party Payment Delays: "Show me the failure rate and average response time for external HTTP dependencies calling 'api.stripe.com' (or your payment provider) over the last 7 days."
- Promotion Engine Overhead: "Did the average request duration of the /checkout API endpoint increase after our deployment at 2 PM today?"
You can also ask the agent to find root causes: "Why did checkout requests fail more frequently between 2 PM and 4 PM today?" The Copilot will analyse exceptions and dependency failures during that window and summarise the findings.
Scenario 2: Diagnosing CMS 12/13 Rendering and Headless Delivery
With CMS 12 and 13 running on ASP.NET Core, performance is incredibly fast out of the box. However, bottlenecks usually occur around custom block rendering, complex tag helpers, or heavy utilisation of Optimizely Graph and Content Delivery APIs in headless architectures.
Uncovering Headless and Search Bottlenecks
If your frontend Next.js application relies heavily on Optimizely Graph or Search & Navigation, a poorly optimised GraphQL query or .Filter() statement will cause cascading slowdowns.
Try prompting the Observability Agent with:
"Identify the top 5 slowest outgoing HTTP requests to our Optimizely Graph or Search endpoints over the last 3 days. What CMS pages or API routes were users requesting when these slow calls happened?"
The agent will automatically correlate the dependencies table with the requests table, saving you the hassle of writing complex cross-table joins.
Investigating ASP.NET Core Memory and Caching
CMS 12/13 utilises heavily optimised memory caching in .NET Core. If the cache is invalidated too frequently, you'll see a spike in SQL queries to the core CMS database.
"Has there been an unexpected spike in dependency calls to the core CMS SQL database in the last 12 hours compared to the previous week? If so, what are the most common SQL commands being executed?"
If an editor publishes a massive content change that clears a large portion of the cache, the Copilot can help you correlate that spike in database traffic directly to the time the editor hit "Publish."
Scenario 3: Post-Deployment Verification on DXP
Deploying modern .NET applications to Optimizely DXP involves swapping slots in Production. The moments immediately following a slot swap are critical. Instead of staring at a raw stream of logs, you can use the Copilot as an active monitor.
The Post-Deployment Checkup
After a deployment finishes, open the App Insights logs, activate the Agent, and ask:
"Summarise the health of the application over the last 60 minutes. Have any new exception types appeared that were not present in the 24 hours prior?"
The AI will parse the exceptions table, filter out the normal background noise, and highlight genuinely new errors—like a missed dependency injection in your Startup.cs or a misconfigured appsettings.json binding introduced by your latest Commerce 15 release.
If it finds something, you can follow up conversationally:
"For that new InvalidOperationException related to dependency injection, what was the exact stack trace?"
Best Practices for AI-Assisted Telemetry
While the Azure Copilot Observability Agent is a game-changer for Optimizely developers, it works best when you guide it properly:
- Enrich Your Telemetry: Use ITelemetryInitializer in your CMS 12/13 codebase to inject custom properties. Add the CurrentLanguageBranch or CustomerGroup to every request. You can then ask the agent: "Are authenticated B2B users experiencing slower API response times than anonymous users?"
- Track Custom Events: Log specific business events like TrackEvent("ItemAddedToCart") or TrackEvent("GraphQueryExecuted"). This allows you to ask the agent business-centric questions.
- Be Specific with Timeframes: Vague questions yield vague answers. Always specify the time window (e.g., "between 10 AM and noon UTC yesterday").
Conclusion
The addition of the Azure Copilot Observability Agent to Application Insights drastically lowers the barrier to entry for deep telemetry analysis in modern Optimizely environments. By focusing your natural language queries on the specific architectural patterns of CMS 12/13 (like ASP.NET Core caching and Graph API calls) and Commerce 14/15 (like asynchronous cart processing), you can dramatically reduce your mean time to resolution (MTTR) and ensure a blazingly fast digital experience.
How can Niteco help you?
Niteco is the largest global certified Optimizely CMS and Commerce partner, and we are experts and specialists in the Optimizely agent platform. We have recently attended Opticon New York 2026 as a sponsored partner, and we'll be coming back next week to London. Come and find us at our stand, or by looking for our yellow trousers.
#1
Optimizely
The largest global partner. Powered by technical excellence and innovation. Accelerated by AI.
400+
AI-trained experts
Certified by leading platforms like Optimizely, Microsoft, Contentful & Adobe.
2000+
Successful projects
We have vast experience from years of delivering digital platforms for clients in diverse sectors.
9
Optimizely MVPs
Largest team with OMVPs. Meaning the best & most experienced Optimizely minds will work with you.
As Optimizely's largest certified partner in Optimizely CMS, Commerce, and the agent platform, we can help you with any of your strategic initiatives globally around content, commerce, or your organisational AI.
If you would like help getting more out of your Optimizely DXP telemetry, get in touch with us at Niteco: https://niteco.com/contact-us/
Great insights, Scott! The addition of the Azure Copilot Observability Agent to Application Insights feels like a real game-changer for Optimizely DXP teams.